
Opis
Zrewolucjonizuj swoje trading dzięki najlepszym wskaźnikom wzorców wykresów cTrader
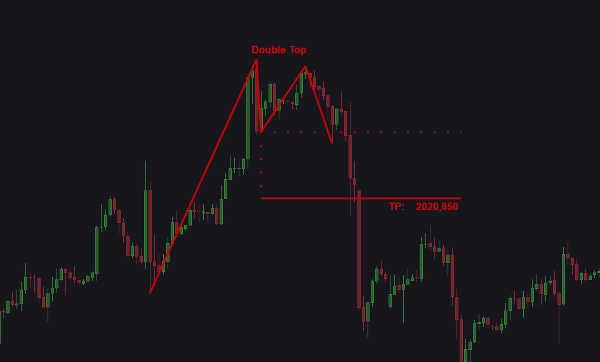
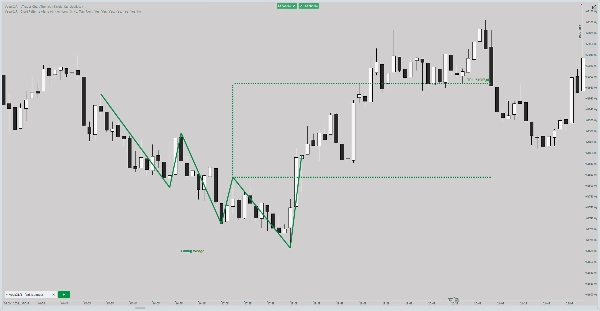
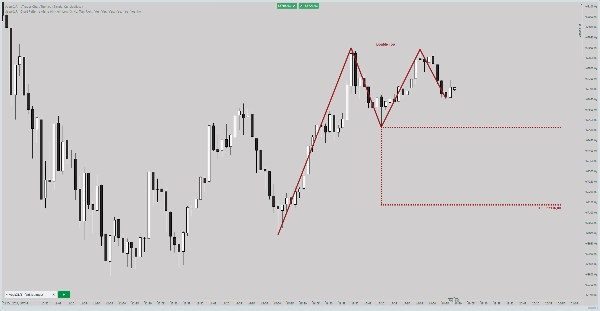
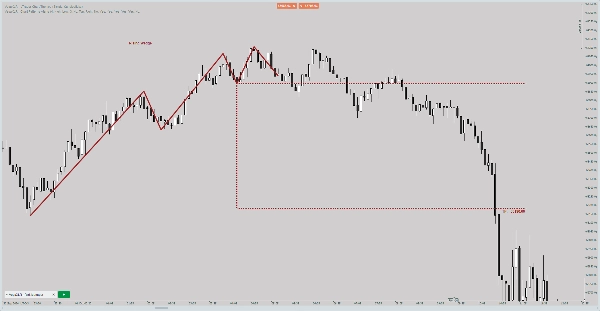
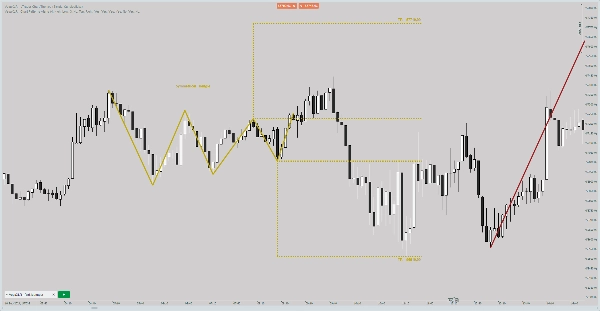
Przenieś swoją strategię handlową na wyższy poziom dzięki temu nowoczesnemu wskaźnikowi cTrader, zaprojektowanemu do wykrywania i wyróżniania kluczowych wzorców wykresów dla precyzyjnej analizy rynku. To zaawansowane narzędzie identyfikuje kluczowe wzorce, takie jak Podwójne Szczyty, Głowa i Ramiona, Trójkąty Wznoszące się i inne, dając traderom potężną przewagę w foreksie, handlu na giełdzie oraz na wszystkich rynkach dostępnym na platformie cTrader.
Kluczowe cechy:
- Automatyczne wykrywanie wzorców wykresów: Natychmiastowe wykrywanie wzorców takich jak Bycze Flagi, Symetryczne Trójkąty i Rosnące Kliny.
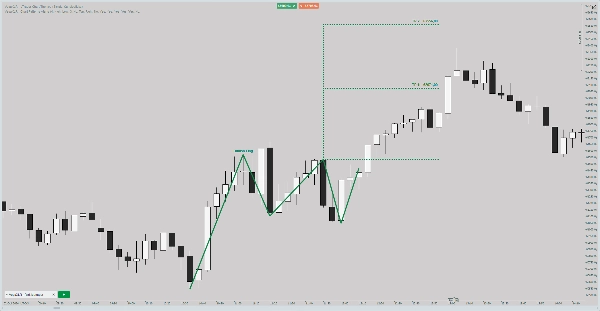
- Rysowanie wahnięć wzorców: Wizualizacja linii szyi, linii docelowych oraz ruchów cenowych z łatwością.
- Dostosowywalne alerty: Bądź na bieżąco dzięki alertom dźwiękowym, wyskakującym okienkom, Telegramowi lub e-mailowi — dostosowane do Twoich potrzeb.
- Wskazówki kodowane kolorami: Szybko rozróżniaj wzorce bycze, niedźwiedzie oraz neutralne wzorce za pomocą dostosowywanych schematów kolorów.
- Lista wzorców ze statystykami: Łatwo śledź wystąpienia wzorców dzięki zintegrowanej liście pokazującej skróty i liczniki.
- Regulowane poziomy powiększenia: Skup się na konkretnych rozmiarach wzorców dla szczegółowej analizy.
- Wyświetlanie potencjału zysku: Oceń potencjalne okazje handlowe dzięki jasnym wskazaniom wielkości zysku.
- Jasność ram czasowych i symboli: Alerty zawierają dokładne informacje o symbolu i ramie czasowym dla świadomego podejmowania decyzji.
- Opcja pauzy alertów: Analizuj wzorce bez rozproszeń, wstrzymując powiadomienia.
- Funkcja notatek użytkownika: Dodawaj komentarze do udoskonalenia strategii lub notatki dotyczące konkretnych wzorców.
Wykrywane wzorce wykresów:
- Podwójny szczyt
- Podwójne dno
- Głowa i ramiona
- Odwrócona głowa i ramiona
- Symetryczny trójkąt
- Trójkąt wznoszący się
- Trójkąt opadający
- Bycza flaga
- Niedźwiedzia flaga
- Rosnący klin
- Opadający klin
Ten intuicyjny wskaźnik handlowy umożliwia traderom łączenie automatycznego wykrywania wzorców wykresów, dostosowywalnych alertów oraz wizualizacji w czasie rzeczywistym. Niezależnie od tego, czy handlujesz na rynku forex, analizujesz wykresy akcji, czy eksplorujesz niestandardowe wskaźniki cTrader, to narzędzie dostarcza Ci wglądu potrzebnego do podejmowania mądrzejszych i pewniejszych decyzji. Idealne dla traderów dążących do opanowania analizy technicznej i optymalizacji swoich strategii zarządzania ryzykiem.
Odblokuj swój potencjał handlowy już dziś dzięki temu kompleksowemu wskaźnikowi cTrader!
Ostrzeżenie:
Ten wskaźnik to narzędzie analizy technicznej, zaprojektowane, aby wspierać traderów poprzez dostarczanie wglądów i wizualizacji opartych na wzorcach wykresów i danych rynkowych. Nie funkcjonuje jako samodzielne rozwiązanie handlowe i nie gwarantuje zyskownych wyników. Użytkownicy muszą stosować własne strategie handlowe, zarządzanie ryzykiem oraz procesy podejmowania decyzji podczas korzystania z tego produktu. Wyniki historyczne nie są wskaźnikiem przyszłych rezultatów. Handel na rynkach finansowych wiąże się ze znacznym ryzykiem i powinieneś handlować tylko kapitałem, który możesz sobie pozwolić stracić.
Podsumowanie
Key functionalities include automatic pattern detection, real-time visualization of pattern components like necklines and target lines, and customizable alerts delivered via sound, pop-up, Telegram, or email. It features color-coded insights to distinguish bullish, bearish, and neutral patterns, a pattern list with occurrence statistics, adjustable zoom levels for detailed analysis, and profit potential display to evaluate trade opportunities. Alerts provide clear symbol and timeframe information, and users can pause notifications or add personal notes for strategy refinement.
This tool assists traders in technical analysis and risk management by providing actionable insights based on chart patterns. It is intended as a supportive tool and does not function as a standalone trading solution. Users must apply their own trading strategies and risk controls when using this indicator.
Opinie klientów
5 | 67 % | |
4 | 0 % | |
3 | 33 % | |
2 | 0 % | |
1 | 0 % |


