
설명
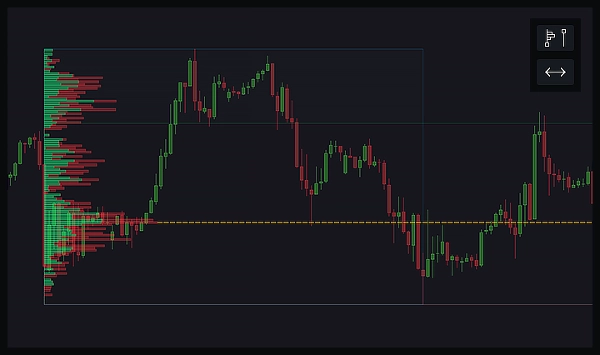
고정 범위 볼륨 프로필은 차트의 특정 범위 내에서 다양한 가격 수준에서 얼마나 많은 거래 활동이 있었는지를 보여주는 도구입니다. 관심 있는 영역 위에 사각형을 그리면, 프로필은 해당 범위 내 각 가격 수준에서의 거래량을 나타내는 수평 막대를 표시합니다. 이를 통해 가장 많은 매수 및 매도가 발생한 위치를 확인할 수 있으며, 거래 결정을 내리는 데 중요한 주요 가격 수준을 강조합니다.
고정 범위 볼륨 프로필의 주요 구성 요소는 다음과 같습니다:
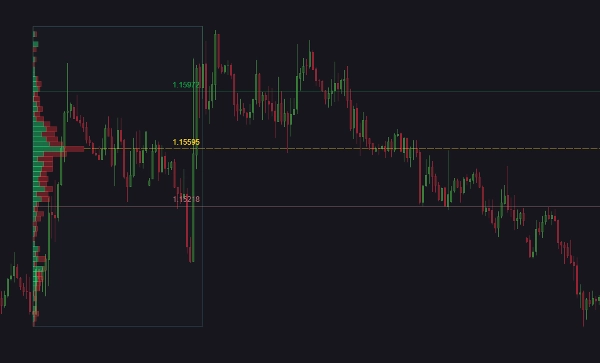
- 포인트 오브 컨트롤(POC): 선택한 범위 내에서 가장 높은 거래량을 가진 가격 수준입니다. 이는 많은 거래 활동이 이루어진 가격을 반영하기 때문에 중요한 지지 또는 저항 수준으로 간주됩니다.
- 밸류 에어리어 하이(VAH): 전체 거래량의 70%가 발생한 가격 범위의 상한선입니다. 이 수준 위의 가격은 거래가 적고 잠재적으로 과대평가된 것으로 간주됩니다.
- 밸류 에어리어 로우(VAL): 전체 거래량의 70%가 발생한 가격 범위의 하한선입니다. 이 수준 아래의 가격은 거래가 적고 잠재적으로 저평가된 것으로 간주됩니다.
이 선들은 트레이더가 지지 또는 저항 역할을 할 수 있는 중요한 가격 수준을 식별하는 데 도움을 줍니다. 거래량이 집중된 위치를 이해함으로써, 트레이더는 잠재적인 가격 움직임, 진입 및 청산 지점에 대해 더 정보에 기반한 결정을 내릴 수 있습니다.
예를 들어, 현재 가격이 POC 근처에 있다면 강력한 지지 또는 저항 수준을 나타낼 수 있습니다. 가격이 밸류 에어리어 내에 있으면 공정 가치 범위에 있음을 시사하며, 밸류 에어리어 밖의 가격은 잠재적인 돌파 또는 붕괴 지점으로 간주될 수 있습니다.
이 지표의 기능:
이 지표는 강력한 볼륨 프로필 분석과 사용자 정의 가능한 알림으로 거래 차트를 향상시킵니다. 두 개의 직관적인 버튼으로 고정 범위 볼륨 프로필을 쉽게 그릴 수 있으며, 주요 수준을 무한대로 확장하거나 축소할 수 있습니다. 볼륨 프로필은 전체 또는 상승 및 하락 막대의 두 가지 모드로 시각화할 수 있습니다. 필요에 따라 수준 수, 데이터 해상도(정밀 또는 빠름), 밸류 에어리어 크기를 조정할 수 있습니다.
마그네틱 범위는 마지막 캔들에 따라 자동으로 업데이트되어 분석이 최신 상태로 유지됩니다. 또한 POC, VAH, VAL 선을 포함한 프로필 및 구성 요소의 외관과 동작을 사용자 정의할 수 있습니다. 가격 접촉 시 알림을 설정할 수 있으며, cBot 시작 또는 중지, 포지션 청산과 같은 작업을 트리거하는 옵션도 있습니다. 알림은 소리, cTrader 팝업, 텔레그램 메시지(선택적 스크린샷 포함), 이메일을 통해 전달될 수 있습니다.
특징:
- 고정 범위 볼륨 프로필: 선택한 범위의 볼륨 프로필을 시각화하기 위해 사각형을 그립니다.
- 선 확장/축소: POC, VAH, VAL 선을 무한대로 확장하거나 축소합니다.
- 볼륨 프로필 모드: 전체 볼륨 또는 상승 및 하락 막대 중 선택할 수 있습니다.
- 사용자 정의 가능한 수준 및 해상도: 수준 수와 해상도(정밀 또는 빠름)를 선택합니다.
- 조정 가능한 밸류 에어리어: 밸류 에어리어 크기를 설정합니다.
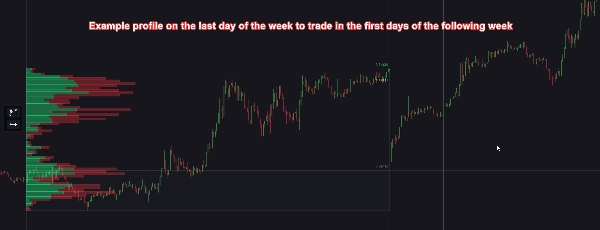
- 마그네틱 범위: 마지막 캔들에 맞춰 범위를 자동으로 조정하며, 1~10분마다 또는 바 종료 시 업데이트됩니다.
- 사용자 정의 가능한 외관: 버튼, 선, 볼륨 막대의 위치, 크기 및 스타일을 변경할 수 있습니다.
- 가격 접촉 알림: 가격이 POC, VAH, VAL 선에 닿을 때 알림을 받습니다.
- cBot 통합: 알림에 따라 cBot을 시작하거나 중지합니다.
- 포지션 관리: 알림 발생 시 포지션을 청산하며, 각 선(POC, VAH, VAL)에 대해 사용자 정의 옵션이 있습니다.
- 알림 방법: 소리, cTrader 팝업, 텔레그램 메시지(선택적 스크린샷 포함), 이메일을 통해 알림을 받습니다.
- 성능 최적화: 차트에 보이지 않는 과거 범위를 자동 삭제하여 성능을 향상시킬 수 있습니다.
- 글로벌 알림 제어: 이 지표의 모든 알림을 쉽게 활성화하거나 비활성화할 수 있습니다.
- 사용자 가이드: 차트의 작은 버튼을 통해 이 지표의 사용자 가이드를 쉽게 열 수 있습니다.
요약
The indicator offers two visualization modes: total volume or separate up and down volume bars. It features customizable settings for the number of volume levels, data resolution (Precise or Fast), and value area size. Magnetic ranges automatically update based on the latest candle to keep analysis current. Users can expand or contract POC, VAH, and VAL lines infinitely.
Alerts can be configured for price touches on these key levels, with notifications via sound, platform pop-ups, Telegram (including optional screenshots), and email. Alerts can trigger actions such as starting/stopping cBots or closing positions. The indicator also supports customizable appearance, performance optimization by auto-deleting out-of-view ranges, and global alert control. A user guide is accessible directly from the chart interface.
고객 리뷰
5 | 67 % | |
4 | 0 % | |
3 | 33 % | |
2 | 0 % | |
1 | 0 % |


