
설명
MACD Custom MTF (Multiple Time Frame) v1.1 은 고전적인 MACD의 검증된 힘과 다중 시간 프레임 분석의 중요한 이점, 그리고 현대적이고 직관적인 시각화를 결합한 고급 도구입니다. 정밀함, 빠른 해석, 그리고 고유한 전략에 맞게 도구를 맞춤 설정할 수 있는 능력을 요구하는 안목 있는 트레이더를 위해 설계되었습니다.
버전 1.1의 새로운 기능:
- 100% 부드러운 시각화: 끊기거나 불연속적이던 MACD 라인을 수정했습니다 – 추세 변화 시 라인이 완벽하게 연속됩니다.
- 더 나은 가시성: 매수/매도 신호 점의 크기를 키우고, 시그널 라인과 히스토그램을 두껍게 하여 매우 선명한 시야를 제공합니다. 눈의 피로를 줄이기 위해 제로 라인을 희미하게 처리했습니다.
- 스마트하고 단순화된 알림: 설정 창을 정리했습니다. "매수 알림" 또는 "매도 알림"을 토글하면 지표가 자동으로 화면 팝업과 올바른 사운드 알림을 처리합니다.
- 체계적인 설정: 모든 매개변수가 직관적인 카테고리로 아름답게 그룹화되어 훨씬 나은 사용자 경험을 제공합니다.
- 완전한 영어 현지화: 모든 로그 메시지, 팝업, 오류가 완전히 영어로 현지화되었습니다.
단일 차트에서의 다중 시간 프레임(MTF) 분석:
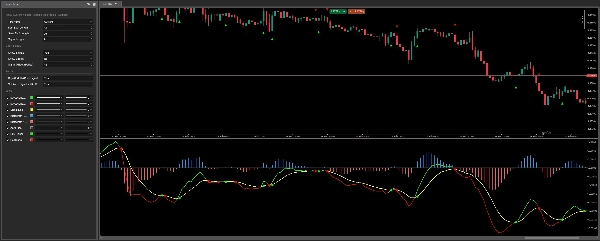
차트 전환을 멈추세요! 상위 시간 프레임(e.g., H1, H4, D1)의 MACD 데이터를 현재 작업 중인 차트(e.g., M5, M15)에 직접 표시합니다. 귀중한 광범위한 시장 맥락을 얻고, 지배적인 기본 추세를 식별하며, 하위 시간 프레임의 오도하는 노이즈를 효과적으로 걸러냅니다. 완전 구성 가능하며, 분 단위부터 월 단위까지 포괄적인 시간 프레임 목록에서 선택할 수 있습니다.
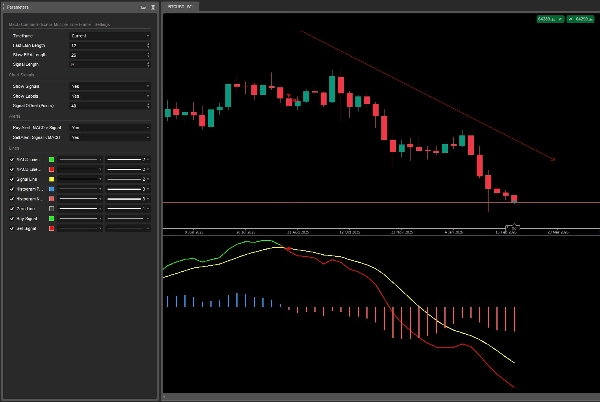
동적 MACD 및 시그널 라인 색상 변경:
즉각적인 추세 확인: MACD 라인은 시그널 라인을 교차할 때 동적으로 색상이 변경되어 강세 또는 약세 모멘텀을 생생하게 보여줍니다. 더 이상 추측할 필요 없이 라인 색상만으로 MACD가 시그널 위(강세)인지 아래(약세)인지 즉시 알 수 있습니다.
선명한 히스토그램:
MACD와 시그널 라인 간의 발산(강도)을 쉽게 시각화합니다. 지표는 두꺼워진 막대를 직관적으로 양수(파란색) 또는 음수(빨간색)에 따라 색칠하여 한눈에 모멘텀 변화를 깊이 있게 제공합니다.
명확한 시각적 교차 신호:
중요한 교차를 절대 놓치지 마세요! 지표는 MACD/시그널 라인 교차를 자동으로 강조합니다. 조정 가능한 오프셋과 함께 가격 차트에 뚜렷하고 매우 잘 보이는 점을 표시하며, 궁극적인 명확성을 위해 선택적 "매수"/"매도" 텍스트 라벨을 제공합니다.
통합 스마트 알림:
매수 및 매도 신호에 대한 내장된 번거로움 없는 팝업 및 사운드 알림 기능을 제공합니다. 화면에 붙어 있지 않아도 모든 기회를 놓치지 마세요! 설정에서 알림을 토글하기만 하면 지표가 대신 감시합니다.
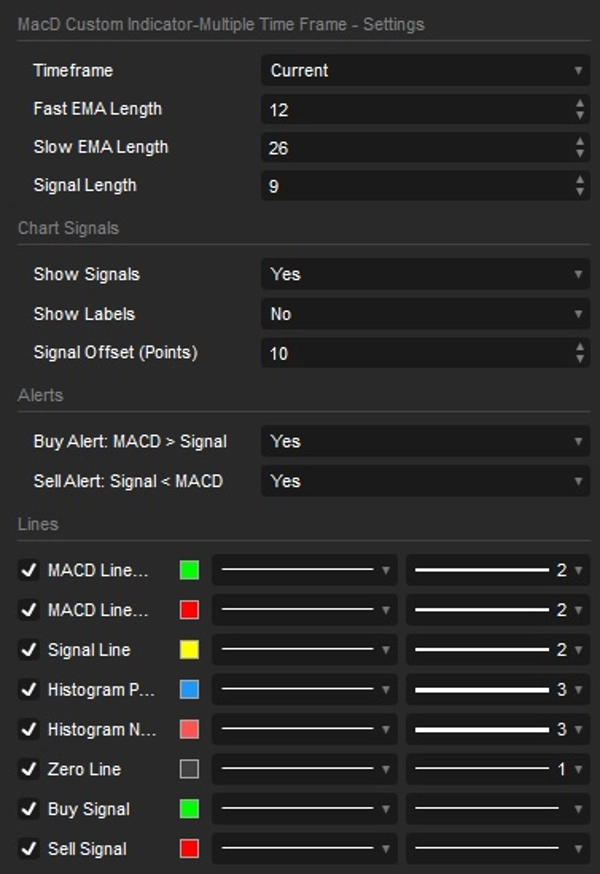
완전한 사용자 맞춤 설정:
- 빠른 EMA, 느린 EMA, 시그널 라인 길이를 정확한 사양에 맞게 조정하세요.
- 모든 설정이 논리적인 그룹(MACD 설정, 차트 신호, 알림)으로 깔끔하게 정리되어 빠른 조정이 가능합니다.
- 개별 시각 요소의 가시성을 토글할 수 있습니다: MACD 및 시그널 라인, 히스토그램, 교차 신호, 라벨.
- 차트 미학과 선호도에 완벽하게 맞도록 조정 가능한 신호 오프셋.
요약
Key features include dynamic coloring of the MACD and signal lines to indicate bullish or bearish momentum, a crystal-clear histogram that visualizes the divergence between MACD and its signal line with color-coded bars, and unmistakable visual crossover signals marked by distinct dots or arrows on the price chart. The indicator supports integrated alerts with popup and sound notifications for buy and sell signals, configurable via a streamlined settings interface.
Users can fully customize the indicator by adjusting Fast EMA, Slow EMA, and Signal Line lengths, toggling visibility of visual elements (lines, histogram, signals, labels), and modifying colors and line thickness. The settings are organized into intuitive categories for ease of use. This indicator supports a wide range of timeframes from minutes to monthly and is suitable for various markets including Forex, indices, commodities, stocks, and cryptocurrencies.
고객 리뷰
5 | 100 % | |
4 | 0 % | |
3 | 0 % | |
2 | 0 % | |
1 | 0 % |


