설명
Signal Strike는 ctrader용으로 설계된 전문 트레이딩 지표로, 차트에 명확하고 높은 신뢰도의 진입 신호를 직접 제공합니다. 추세, 모멘텀, 변동성, 거래량 확인을 결합한 고급 로직으로 구축되어 트레이더가 자신 있게 정확한 매수 및 매도 기회를 식별할 수 있도록 돕습니다.
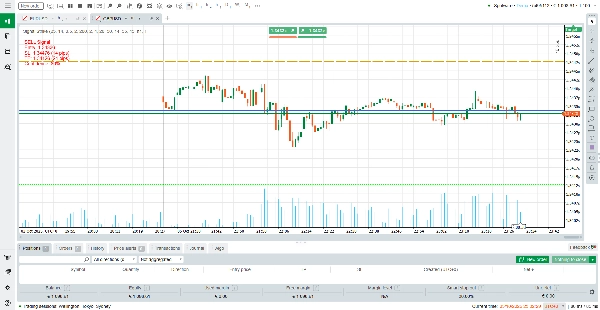
일반적인 지표와 달리 Signal Strike는 우유부단한 캔들과 약한 설정을 걸러내도록 설계되었습니다. 조건이 맞으면 지표는 차트에 진입, 손절, 이익 실현 수준과 신뢰도 백분율을 표시합니다. 유효한 설정이 감지되지 않으면 차트 상단에 “유효한 매수/매도 신호 없음”을 표시하여 언제 행동하고 언제 관망해야 하는지 정확히 알 수 있습니다.
Signal Strike에서는 각 선 색상이 명확한 의미를 가지며 트레이더가 차트를 즉시 읽을 수 있도록 돕습니다. 진입선은 파란색으로 그려져 거래 설정이 발동되는 정확한 가격을 표시합니다. 손절선은 주황색으로 나타나 시장이 불리하게 움직일 경우 거래가 종료되는 보호 수준을 보여줍니다.
이익 실현선은 라임 그린 색상으로 표시되어 이익이 확보되는 목표 수준을 강조합니다. 방향성을 명확히 하기 위해 매수 신호는 녹색으로, 매도 신호는 빨간색으로 강조됩니다. 이 강하고 채도가 높은 색상들은 각 요소가 돋보이도록 하여 진입, 위험, 보상 구역을 한눈에 쉽게 구분할 수 있게 합니다.
신호 읽는 방법
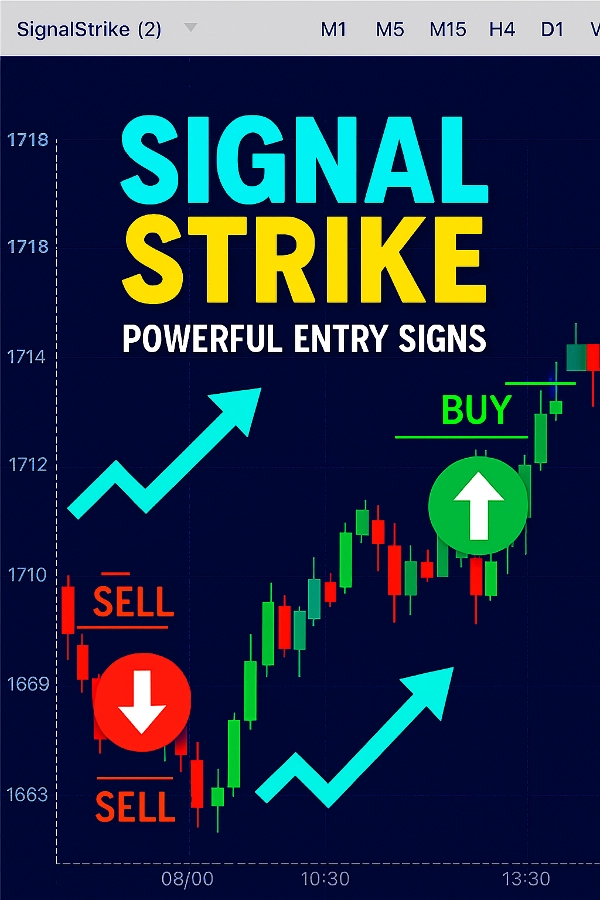
매수 신호: 녹색 위쪽 화살표와 라벨이 나타나 진입 가격, 손절, 이익 실현, 신뢰도 수준을 보여줍니다.
매도 신호: 빨간색 아래쪽 화살표와 라벨이 동일한 세부 정보를 표시합니다.
신호 없음: 시장 상황이 충분히 강하지 않으면 지표가 차트 상단에 “유효한 매수/매도 신호 없음”을 표시합니다.
동적 TP/SL: 이익 실현 및 손절 수준은 변동성과 RSI 조건에 따라 자동으로 조정됩니다.
최대 효과를 위해 시간대(M1, M5, M15, H1, H4)를 전환하며 거래 스타일에 가장 명확한 신호를 찾는 것이 권장됩니다.
지표 작동 방식
Signal Strike는 여러 분석 레이어를 결합합니다:
추세 감지.
모멘텀 필터.
변동성 확인.
거래량 확인.
우유부단 필터 – 작고 약한 캔들은 잘못된 진입을 피하기 위해 무시됩니다.
이 조건들이 모두 맞아야만 지표가 매수 또는 매도 신호를 생성합니다. 이는 모든 신호가 다중 확인을 바탕으로 하여 잡음을 줄이고 정확도를 높임을 보장합니다.
주요 특징 (5가지 하이라이트)
명확한 진입, 손절, 이익 실현 수준 – 차트에서 즉시 확인 가능.
신뢰도 백분율 – 진입 전에 신호의 강도를 알 수 있음.
다중 시간대 지원 – M1부터 H4까지 모든 시간대에서 작동.
자동 필터링 – 우유부단하거나 거래량이 적은 기간 동안 잘못된 신호를 방지.
사용자 친화적 라벨 – 조건이 충족되지 않을 때 “신호 없음” 표시로 읽기 쉬움.
시간대별 권장 설정
지표는 유연한 입력값(LookbackCandles, ATRPeriod, ATRMultiplier, SMA 기간, RSI 수준 등)을 포함합니다. 아래는 다양한 거래 스타일에 최적화된 설정입니다:
M1 (스캘핑)
LookbackCandles: 20
ATRPeriod: 10
ATRMultiplier: 0.4
SMA 빠름/느림: 10 / 30
RSI: 12 (매수 > 55, 매도 < 45) → 빠른 진입을 위한 초단기 스캘핑에 최적.
M5 (빠른 당일 거래)
LookbackCandles: 25
ATRPeriod: 14
ATRMultiplier: 0.5
SMA 빠름/느림: 20 / 50
RSI: 14 (매수 > 55, 매도 < 45) → 단기 당일 거래에 균형 잡힌 설정.
M15 (당일 스윙)
LookbackCandles: 30
ATRPeriod: 14
ATRMultiplier: 0.6
SMA 빠름/느림: 20 / 60
RSI: 14 (매수 > 56, 매도 < 44) → 중간 당일 움직임 포착에 이상적.
H1 (스윙 트레이딩)
LookbackCandles: 40
ATRPeriod: 20
ATRMultiplier: 0.7
SMA 빠름/느림: 30 / 80
RSI: 14 (매수 > 57, 매도 < 43) → 높은 시간대 스윙에 강력한 필터.
H4 (포지션 트레이딩)
LookbackCandles: 50
ATRPeriod: 20
ATRMultiplier: 0.8
SMA 빠름/느림: 50 / 100
RSI: 14 (매수 > 58, 매도 < 42) → 장기 고신뢰 진입에 최적.
왜 Signal Strike를 선택해야 하나요?
Signal Strike는 단순한 지표가 아니라 시간 절약, 불확실성 감소, 최고의 기회에 집중할 수 있도록 돕는 의사결정 도구입니다. M1 스캘퍼든 H4 스윙 트레이더든 Signal Strike는 스타일에 맞게 조정되어 명확하고 정밀한 강력한 진입 신호를 제공합니다.
Signal Strike로 거래를 통제하고 자신감 있는 거래의 차이를 경험하세요.
요약
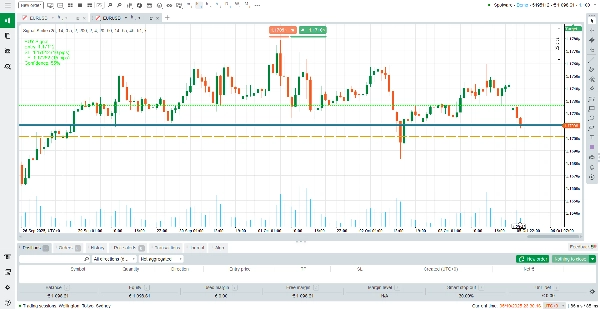
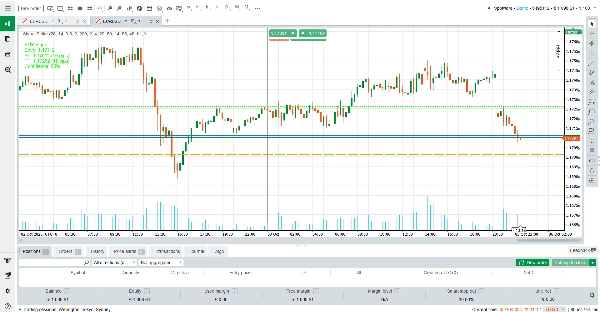
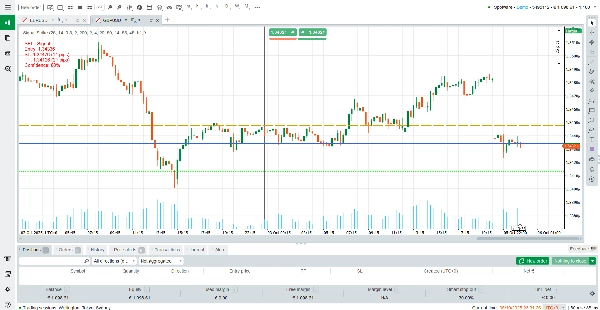
When a valid trade setup occurs, Signal Strike plots entry, stop loss, and take profit levels on the chart, each color-coded for clarity: blue for entry, orange for stop loss, and lime green for take profit. BUY signals are marked with green arrows and labels, while SELL signals use red. A confidence percentage accompanies each signal to indicate its strength. If no valid setup is detected, a “No valid BUY/SELL signal” message appears.
The indicator supports multiple timeframes from M1 to H4, with recommended settings optimized for scalping, intraday, swing, and position trading styles. Take profit and stop loss levels adjust dynamically based on volatility and RSI conditions. Signal Strike aims to assist traders in making informed decisions by highlighting clear entry points, risk levels, and profit targets across various markets including Forex, commodities, crypto, and stocks.
고객 리뷰
5 | 50 % | |
4 | 0 % | |
3 | 50 % | |
2 | 0 % | |
1 | 0 % |