
Описание
Stop Loss Pro — это мощный бесплатный индикатор для cTrader, созданный для устранения догадок в управлении рисками. Основанный на продвинутом анализе структуры рынка, он автоматически определяет и отображает наиболее надежные уровни стоп-лосса прямо на вашем графике. С этим инструментом трейдеры могут уверенно защищать свои сделки, зная, что каждый предложенный уровень подкреплен сочетанием технической логики, динамики объема и фильтров волатильности.
Как это работает
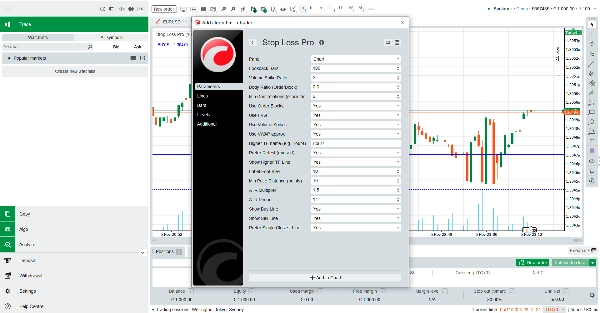
При подключении к вашему графику Stop Loss Pro непрерывно сканирует недавние ценовые движения, всплески объема, формирование блоков ордеров, пробелы справедливой стоимости и диапазоны волатильности. На основе этого анализа он рассчитывает наиболее стратегические уровни стоп-лосса для сценариев покупки и продажи.
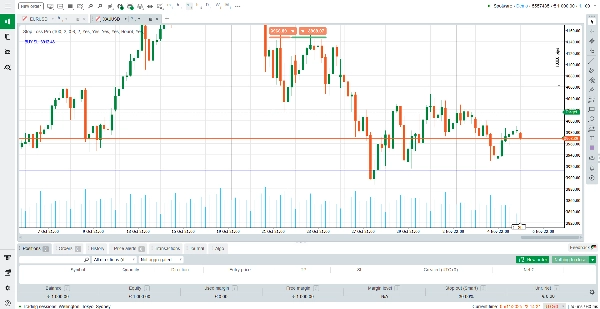
Синяя линия представляет рекомендуемый уровень стоп-лосса для сделок на покупку. Эта линия всегда размещается ниже текущей рыночной цены на расстоянии, которое балансирует между безопасностью и эффективностью.
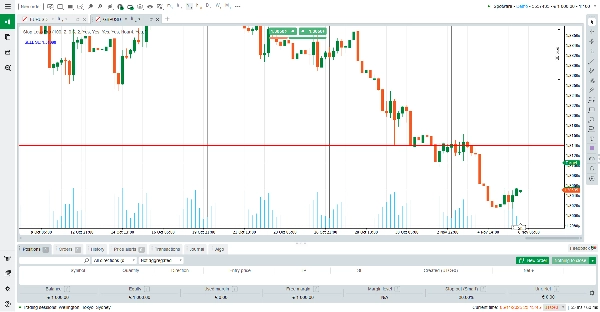
Красная линия представляет рекомендуемый уровень стоп-лосса для сделок на продажу. Эта линия всегда размещается выше текущей рыночной цены, обеспечивая защиту коротких позиций от внезапных разворотов.
В зависимости от ваших настроек индикатор может показывать обе линии одновременно или сосредоточиться только на одном ближайшем и наиболее релевантном уровне. Эта гибкость позволяет трейдерам адаптировать инструмент под свой стиль — будь то консервативное подтверждение двумя линиями или упрощенная ясность одной линии.
Чтение информации
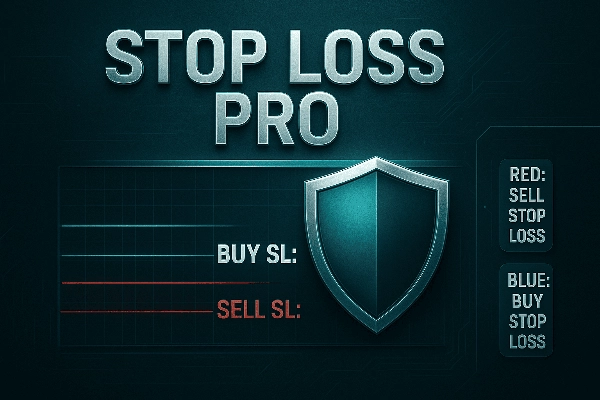
В левом верхнем углу вашего графика Stop Loss Pro отображает четкую метку с активной рекомендацией по стоп-лоссу. Например:
«BUY SL: 1.2345» означает, что индикатор определил сильный защитный уровень для длинных позиций на уровне 1.2345.
«SELL SL: 1.2450» означает, что индикатор предлагает установить стоп-лосс для коротких позиций на уровне 1.2450.
Если оба сигнала действительны, индикатор выделяет тот, который ближе к текущей рыночной цене, помогая вам действовать быстро и решительно.
Почему это важно
Установка стоп-лосса — один из самых критичных аспектов трейдинга. Слишком близко — и вы рискуете быть выбитыми шумом рынка. Слишком далеко — и вы подвергаетесь ненужным потерям. Stop Loss Pro решает эту проблему, сочетая несколько методов подтверждения — фильтры волатильности ATR, обнаружение блоков ордеров, анализ объема и приближение VWAP — чтобы предоставлять уровни, которые одновременно реалистичны и защитны.
Ключевые особенности
Двойные линии стоп-лосса — мгновенно видны уровни защиты для покупок и продаж, цветовые коды для наглядности.
Умная фильтрация — использует ATR, всплески объема и логику блоков ордеров, чтобы избегать слабых или случайных уровней.
Осведомленность о старших таймфреймах — опционально отображает линии подтверждения с больших таймфреймов для дополнительной уверенности.
Гибкие режимы отображения — выбирайте между показом обеих линий или только одного ближайшего уровня к рынку.
Бесплатно и просто в использовании — никаких скрытых затрат, никакой сложности — просто подключите к графику и торгуйте с уверенностью.
Заключительное слово
Stop Loss Pro — это не просто индикатор, это торговый помощник, который помогает вам управлять рисками с точностью. Независимо от того, новичок ли вы, изучающий важность установки стоп-лосса, или опытный трейдер, ищущий надежный инструмент подтверждения, этот индикатор обеспечивает ясность, дисциплину и душевное спокойствие. И самое главное — он полностью бесплатен для скачивания и использования.
Возьмите под контроль управление рисками уже сегодня с Stop Loss Pro для cTrader.
Сводка
The tool integrates multiple technical factors such as Average True Range (ATR) volatility filters, volume dynamics, order block detection, and VWAP approximations to provide stop-loss levels that balance protection and efficiency. It also offers optional higher-timeframe confirmations for added reliability. A clear label on the chart indicates the active stop-loss recommendation, aiding quick decision-making.
Stop Loss Professional supports various markets including Forex, indices, commodities, cryptocurrencies, and stocks. It is suitable for different trading styles and strategies such as breakout and scalping. The indicator aims to enhance trade protection by reducing the risk of premature stop-outs or excessive losses through informed stop-loss placement.


![Логотип продукта "[Stellar Strategies] Inside Bar with Signals"](https://cdn.ctrader.com/image/webp/1d9e8bfa-3b2c-4440-bb37-5856902008a7_30683)


