
説明
キャンドルプレッシャーインデックス(CPI)は、各キャンドルの背後にある隠れた買い圧力と売り圧力を明らかにするために設計された、強力でありながら使いやすいインジケーターです。価格が単に上昇したか下降したかを示すだけでなく、CPIは各キャンドル内で買い手または売り手がどれほど強く市場を支配していたかを深く掘り下げます。これにより、トレンドの強さを特定し、早期の反転を見つけ、より高い精度でエントリーやエグジットポイントを確認するためのユニークなツールとなっています。
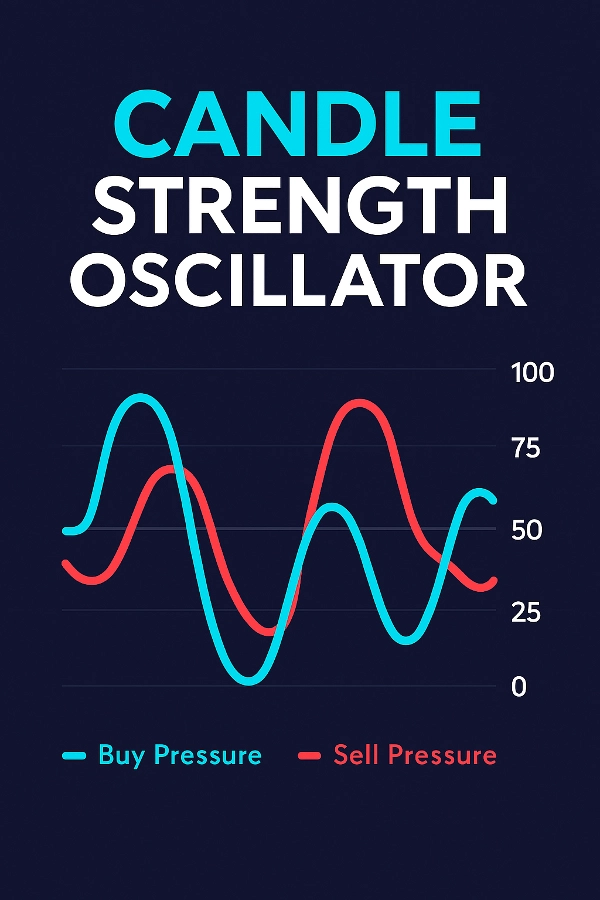
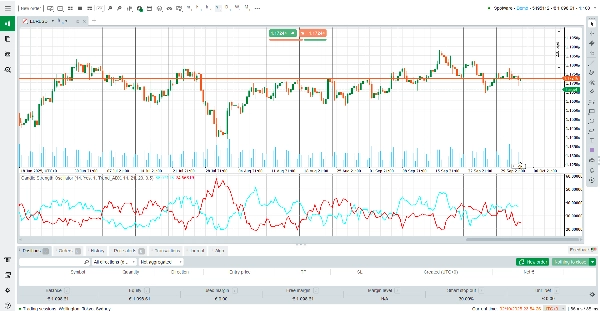
価格にのみ反応する従来のオシレーターとは異なり、CPIはキャンドルのボディの動き、モメンタム、出来高の重み付け、トレンド分析(ADXまたはEMA)を組み合わせて、市場圧力の包括的なビューを提供します。2本の滑らかなライン – 買い圧力(シアン)と売り圧力(赤) – により、トレーダーはどちらの市場側が支配しているかを瞬時に把握できます。
インジケーターの読み方
買い圧力(シアンライン) – 強気の支配力の強さを表します。ラインが上昇していると、買い手の優勢が増していることを示します。
売り圧力(赤ライン) – 弱気の支配力の強さを表します。ラインが上昇していると、売り圧力が強まっていることを示します。
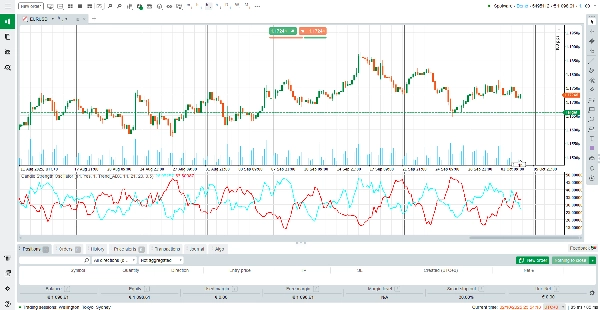
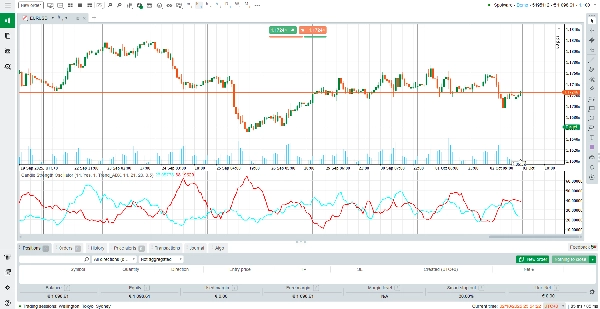
クロスオーバー – 買いラインが売りラインを上回ると、強い買い圧力のシグナル(潜在的な買いの機会)を示します。売りラインが上回ると、売り圧力が支配的(潜在的な売りの機会)となります。
50レベルゾーン – 中央付近(約50)の読み値は買い手と売り手のバランスを示し、極端な読み値(75以上または25以下)は強い方向性の圧力を示します。
トレンドファクターブースト – インジケーターはADXまたはEMAの傾斜によるトレンド確認に基づいてシグナルを調整し、横ばい市場での誤シグナルを減らします。
インジケーターの仕組み
CPIは以下を考慮した加重モデルを使用して圧力を計算します:
キャンドル構造:ボディの大きさと高値/安値に対する終値の位置。
モメンタム:前のキャンドルと比較した価格の動き。
出来高:ティックボリュームの重み付けにより、高出来高の動きがより重要視されます。
トレンド確認:ADXの強さまたはEMAの傾斜がブーストファクターを加え、シグナルを現在のトレンドに合わせます。
平滑化:ユーザー定義のSMAフィルターにより、応答性を損なうことなく滑らかで安定したラインを実現します。
この高度な計算式により、CPIは単に価格に反応するだけでなく、価格がなぜ動いているのかを理解し、トレーダーに市場の動向に関するより深い洞察を提供します。
主な特徴
デュアルライン表示 – 色分けされたライン(買い手はシアン、売り手は赤)で買い圧力と売り圧力を瞬時に比較可能。
適応型トレンドブースト – ADXまたはEMAを統合し、トレンド方向を確認し誤シグナルを減少。
出来高対応計算 – ティックボリュームで重み付けし、実際の市場参加に裏付けられた動きを強調。
滑らかでクリーンな表示 – 内蔵のSMAフィルターにより、遅延のない滑らかな読み取りを実現。
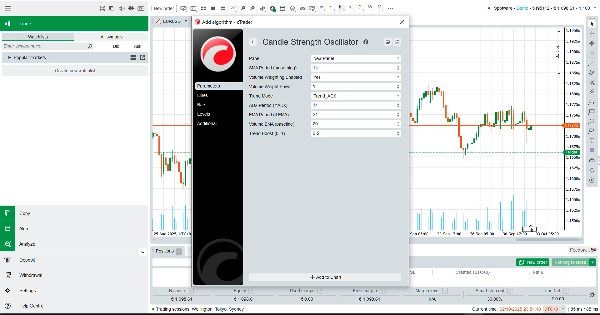
完全カスタマイズ可能 – 期間、重み付け、ブースト強度を調整し、あらゆるトレードスタイルに対応。
なぜキャンドルプレッシャーインデックスを使うのか?
CPIは単純な価格変動を超えて、買い手と売り手の真の戦いを見たいトレーダーに最適です。スキャルパー、スイングトレーダー、トレンドフォロワーのいずれであっても、この無料インジケーターはエントリーのタイミング、リスク管理、市場の真の方向性に沿った取引を行うための明確さを提供します。
今日、キャンドルプレッシャーインデックス(CPI)をダウンロードし、各キャンドルを動かす隠れた力を理解して自信を持って取引しましょう。
概要
The indicator displays two smooth lines: Buy Pressure (cyan) and Sell Pressure (red). Crossovers between these lines signal shifts in market dominance, helping traders identify trend strength, potential reversals, and optimal entry or exit points. Readings near the midpoint indicate balance, while extremes suggest strong directional pressure.
CPI incorporates volume-weighted calculations and trend-based boosts to reduce false signals during sideways markets. It includes a smoothing filter for stable, responsive readings and offers customization of periods, weighting, and trend boost intensity.
This tool is applicable across various markets including Forex, commodities, stocks, and cryptocurrencies, supporting trading strategies such as scalping and breakout trading. It aims to provide traders with enhanced insight into market dynamics beyond simple price action.
カスタマーレビュー
5 | 0 % | |
4 | 100 % | |
3 | 0 % | |
2 | 0 % | |
1 | 0 % |


![「[Stellar Strategies] Moving Averages Combined 1.0」ロゴ](https://cdn.ctrader.com/image/webp/93692c9d-ac16-4dd8-ba83-5a62250c39a9_27250)


