Descrição
Stop Loss Pro é um indicador poderoso e gratuito para cTrader, projetado para eliminar as suposições na gestão de risco. Baseado em uma análise avançada da estrutura do mercado, ele identifica e exibe automaticamente os níveis de stop‑loss mais confiáveis diretamente no seu gráfico. Com esta ferramenta, os traders podem proteger suas operações com confiança, sabendo que cada nível sugerido é respaldado por uma combinação de lógica técnica, dinâmica de volume e filtros de volatilidade.
Como Funciona
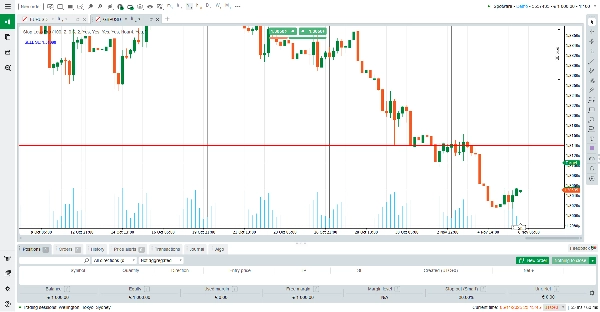
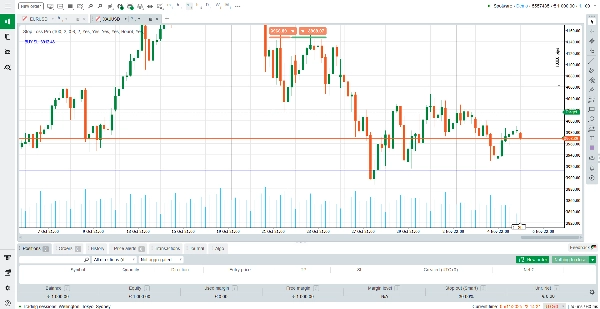
Quando anexado ao seu gráfico, o Stop Loss Pro escaneia continuamente a ação recente do preço, picos de volume, formações de blocos de ordens, gaps de valor justo e faixas de volatilidade. A partir dessa análise, calcula os níveis de stop‑loss mais estratégicos para cenários de compra e venda.
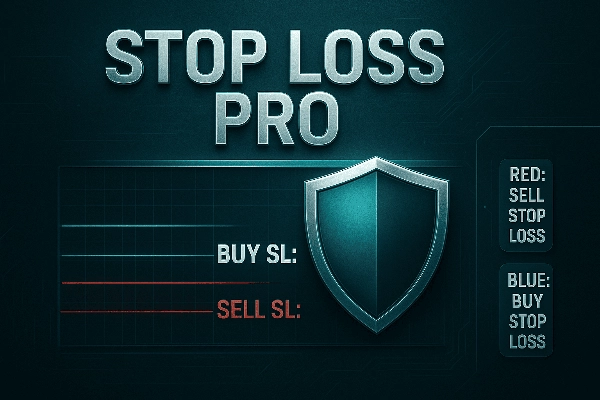
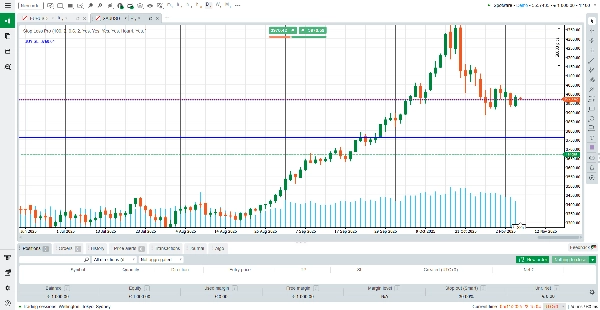
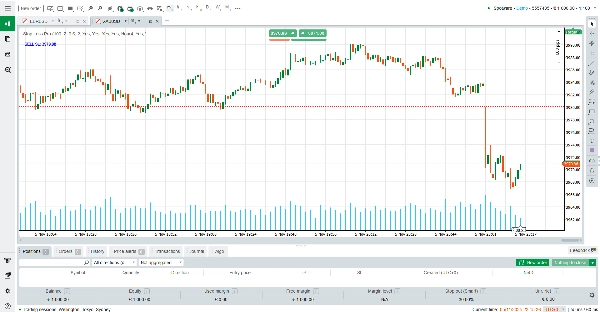
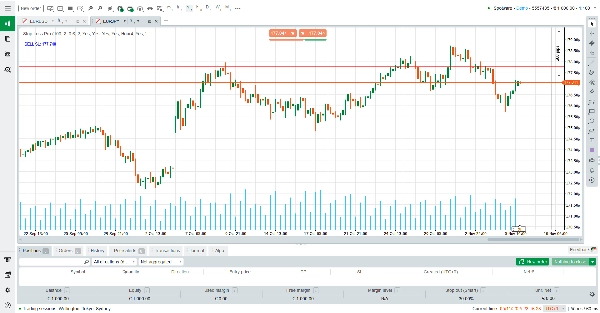
A linha azul representa o nível de stop‑loss recomendado para operações de compra. Esta linha está sempre posicionada abaixo do preço atual de mercado, a uma distância que equilibra segurança com eficiência.
A linha vermelha representa o nível de stop‑loss recomendado para operações de venda. Esta linha está sempre posicionada acima do preço atual de mercado, garantindo que posições vendidas estejam protegidas contra reversões súbitas.
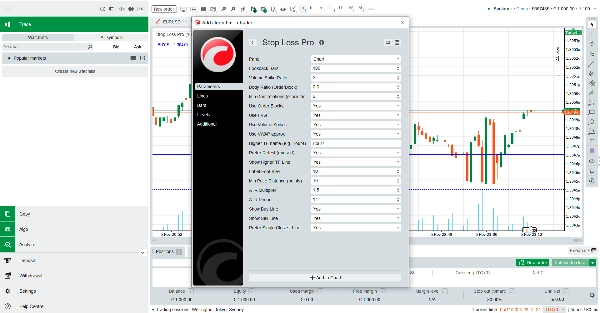
Dependendo das suas configurações, o indicador pode mostrar ambas as linhas ao mesmo tempo ou focar apenas no nível único mais próximo e relevante. Essa flexibilidade permite que os traders adaptem a ferramenta ao seu estilo pessoal — seja preferindo uma confirmação conservadora com duas linhas ou uma clareza simplificada com uma linha única.
Interpretando as Informações
No canto superior esquerdo do seu gráfico, o Stop Loss Pro exibe um rótulo claro com a recomendação ativa de stop‑loss. Por exemplo:
“BUY SL: 1.2345” significa que o indicador identificou um nível forte de proteção para posições longas em 1.2345.
“SELL SL: 1.2450” significa que o indicador sugere colocar um stop‑loss para posições curtas em 1.2450.
Se ambos os sinais forem válidos, o indicador destaca aquele mais próximo do preço atual de mercado, ajudando você a agir rápida e decisivamente.
Por Que Isso Importa
A colocação do stop‑loss é um dos aspectos mais críticos do trading. Muito próximo, e você corre o risco de ser parado por ruídos do mercado. Muito distante, e você se expõe a perdas desnecessárias. O Stop Loss Pro resolve esse problema combinando múltiplos métodos de confirmação — filtros de volatilidade ATR, detecção de blocos de ordens, análise de volume e aproximação VWAP — para fornecer níveis que são tanto realistas quanto protetores.
Principais Características
Linhas Duplas de Stop‑Loss – Veja instantaneamente os níveis de proteção para compra e venda, codificados por cores para maior clareza.
Filtragem Inteligente – Usa ATR, picos de volume e lógica de blocos de ordens para evitar níveis fracos ou aleatórios.
Consciência de Timeframes Maiores – Exibe opcionalmente linhas de confirmação de timeframes maiores para maior confiança.
Modos de Exibição Flexíveis – Escolha entre mostrar ambas as linhas ou apenas o nível único mais próximo do mercado.
Gratuito e Fácil de Usar – Sem custos ocultos, sem complexidade — basta anexar ao seu gráfico e operar com confiança.
Palavra Final
Stop Loss Pro é mais do que apenas um indicador — é um companheiro de trading que ajuda você a gerenciar o risco com precisão. Seja você um iniciante aprendendo a importância da colocação do stop‑loss ou um trader experiente buscando uma ferramenta confiável de confirmação, este indicador oferece clareza, disciplina e tranquilidade. E o melhor de tudo, é completamente gratuito para baixar e usar.
Assuma o controle da sua gestão de risco hoje com o Stop Loss Pro para cTrader.
Resumo
The tool integrates multiple technical factors such as Average True Range (ATR) volatility filters, volume dynamics, order block detection, and VWAP approximations to provide stop-loss levels that balance protection and efficiency. It also offers optional higher-timeframe confirmations for added reliability. A clear label on the chart indicates the active stop-loss recommendation, aiding quick decision-making.
Stop Loss Professional supports various markets including Forex, indices, commodities, cryptocurrencies, and stocks. It is suitable for different trading styles and strategies such as breakout and scalping. The indicator aims to enhance trade protection by reducing the risk of premature stop-outs or excessive losses through informed stop-loss placement.


![Logótipo de "[Stellar Strategies] MARSI Signal Plotter"](https://cdn.ctrader.com/image/webp/7b2b8da6-8f8e-4646-8d4a-4710c516c01e_25567)