
Daily Open Color Zones
Indikator
346 unduhan
Versi 1.0, Sep 2025
Windows, Mac
4.0
Ulasan: 1
Deskripsi
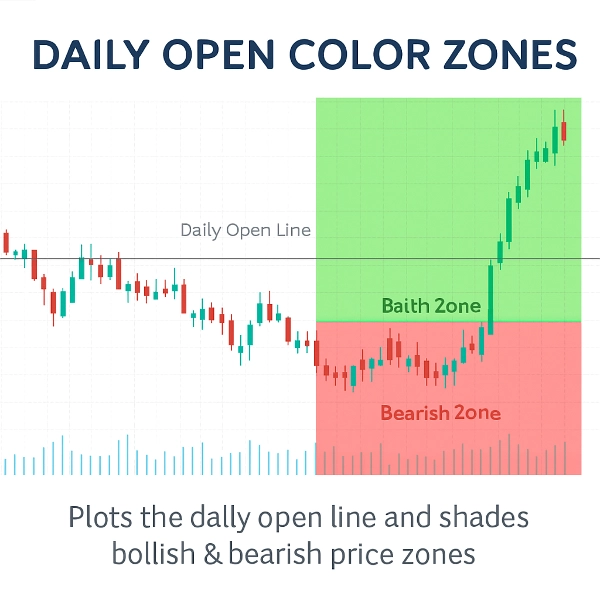
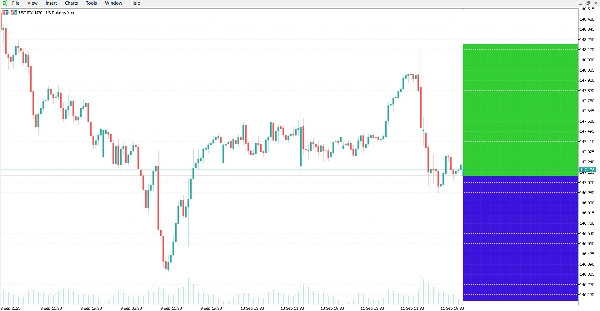
Indikator ini menggambar Garis Pembukaan Harian dan memberi bayangan pada zona harga bullish dan bearish di sekitarnya.
Ini memberikan referensi visual yang jelas untuk melihat apakah pasar diperdagangkan di atas atau di bawah pembukaan harian, yang merupakan level yang umum digunakan dalam analisis intraday.
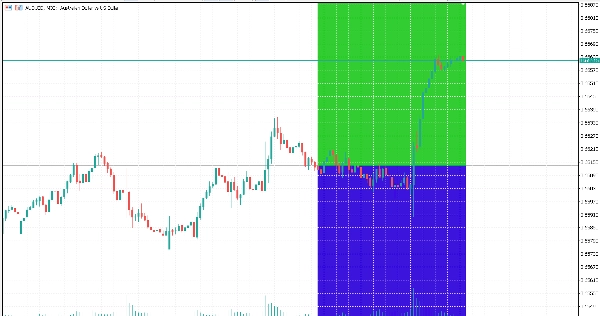
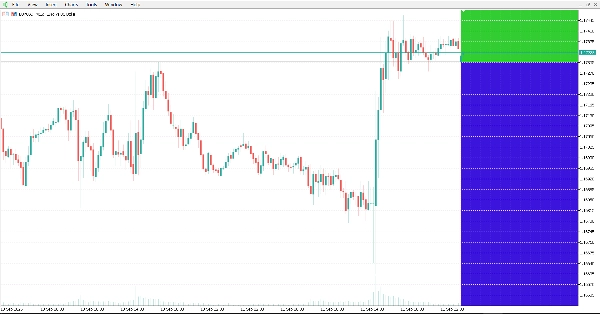
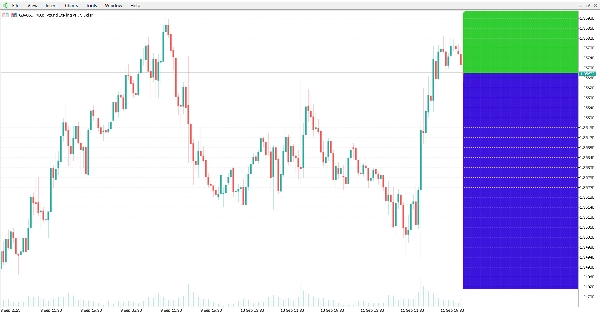
Indikator secara otomatis menggambar garis horizontal pada harga pembukaan harian dan menyoroti area grafik:
- Zona hijau di atas garis (area bullish).
- Zona merah di bawah garis (area bearish).
Fitur:
- Garis Pembukaan Harian Otomatis: penggambaran tepat harga pembukaan harian.
- Zona Warna: dengan mudah membedakan area bullish dan bearish dengan warna yang dapat disesuaikan.
- Pembaruan Dinamis: zona menyesuaikan secara otomatis dengan setiap candle baru.
- Penampilan yang dapat disesuaikan: gaya garis, ketebalan, dan warna zona dapat dimodifikasi.
- Ringan dan efisien: dirancang untuk penggunaan CPU minimal.
- Bekerja pada semua simbol dan kerangka waktu.
Kesimpulan:
Indikator ini menawarkan visualisasi grafik yang jelas dari pembukaan harian dan zona bullish/bearish terkait. Ini dapat diterapkan pada berbagai pasar dan kerangka waktu untuk analisis teknikal.
Ringkasan
Ringkasan AI
The Daily Open Color Zones indicator visually marks the daily open price on trading charts by automatically plotting a horizontal line at this level. It shades the price area above the daily open line in green to indicate bullish zones and the area below in red to indicate bearish zones. These color-coded zones update dynamically with each new candle, providing real-time visual cues about market direction relative to the daily open. The indicator supports all symbols and timeframes, making it applicable across various markets including Forex, cryptocurrencies, and commodities like gold (XAUUSD). Users can customize the line style, thickness, and zone colors to suit their preferences. Designed to be lightweight, it minimizes CPU usage while offering clear intraday reference points commonly used in technical analysis and scalping strategies.
Profil indikator
Ulasan pelanggan
4.0
Ulasan: 1
5 | 0 % | |
4 | 100 % | |
3 | 0 % | |
2 | 0 % | |
1 | 0 % |
Ulasan pelanggan
October 20, 2025
Clean and visual 🎨 - Daily Open Zones make trend bias crystal clear. Great tool for intraday planning and momentum entries!
Diskusi
Pertanyaan umum
Forex
Scalping
EURUSD
Crypto
Grid
XAUUSD
Produk-produk yang tersedia melalui cTrader Store, termasuk bot trading, indikator, dan plugin, disediakan oleh pengembang pihak ketiga serta hanya ditujukan untuk akses teknis dan informasi. cTrader Store bukan broker dan tidak menyediakan saran investasi, rekomendasi pribadi, atau jaminan apa pun tentang kinerja di masa mendatang.


Harga
Sejak 13/09/2025
27
Penjualan
5.4K
Instal gratis