Açıklama
Ultimate Trend ADX, tüccarlara piyasa trendleri ve momentum hakkında daha net, daha dinamik bir görüş sunmak için tasarlanmış klasik Ortalama Yön Endeksi'nin (ADX) güçlü ve geliştirilmiş bir versiyonudur. Standart ADX'in aksine, bu geliştirilmiş araç gelişmiş düzeltme teknikleri (EMA veya KAMA) uygular ve gösterge çizgilerini daha duyarlı ve görsel olarak etkileyici hale getirmek için ölçeklendirme seçenekleri sunar. Sonuç, güçlü trendleri tanımlamanıza, dönüşleri fark etmenize ve girişleri daha yüksek güvenle onaylamanıza yardımcı olan profesyonel düzeyde bir göstergedir.
Göstergenin Okunması
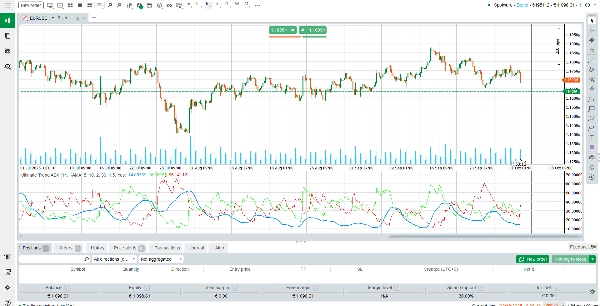
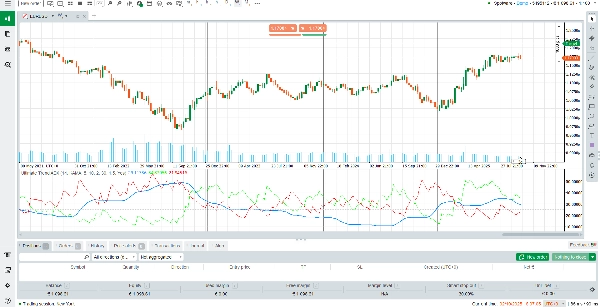
Ultimate Trend ADX, grafiğinizin altında ayrı bir pencerede üç ana çizgi gösterir:
ADX Çizgisi (Mavi/Sarı): Trendin genel gücünü ölçer. Yükselen ADX güçlenen bir trendi, düşen ADX ise zayıflayan momentumu gösterir. 25'in üzerindeki değerler genellikle güçlü bir trendi işaret eder.
+DI Çizgisi (Yeşil): Boğa yönlü hareketi temsil eder. +DI –DI'nin üzerindeyse alıcılar kontrolü elinde tutar.
–DI Çizgisi (Kırmızı): Ayı yönlü hareketi temsil eder. –DI +DI'nin üzerindeyse satıcılar piyasaya hakimdir.
Sinyallerin okunması basittir:
+DI –DI'nin üzerine çıktığında ve ADX yükseliyorsa, bu güçlü bir boğa trendini gösterir.
–DI +DI'nin üzerine çıktığında ve ADX yükseliyorsa, bu güçlü bir ayı trendini işaret eder.
ADX 20–25'in altındaysa, piyasa genellikle yatay seyrediyor veya net bir yönü yoktur.
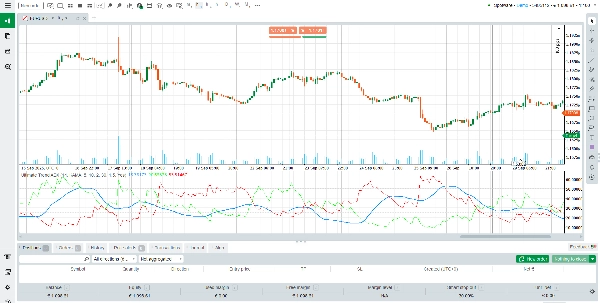
Gösterge ayrıca trendin yoğunluğunu hızlıca ölçmenize yardımcı olmak için 0, 25, 50, 75 ve 100 yatay seviyelerini içerir.
Göstergenin Çalışma Prensibi
Ultimate Trend ADX, standart Yönlü Hareket Sistemi üzerine kuruludur ancak modern düzeltme algoritmaları ile geliştirilmiştir:
Üssel Hareketli Ortalama (EMA): Kısa vadeli momentumu yakalamak isteyen tüccarlar için hızlı ve duyarlı bir düzeltme seçeneği sunar.
Kaufman’ın Adaptif Hareketli Ortalaması (KAMA): Piyasa volatilitesine dinamik olarak uyum sağlar, yatay koşullarda gürültüyü filtrelerken güçlü trendlerde hassas kalır.
+DI ve –DI için Ölçeklendirme Faktörü: Yeşil ve kırmızı çizgileri güçlendirir, boğa ve ayı sinyallerini daha görünür ve grafikte yorumlamayı kolay hale getirir.
Bu kombinasyon, göstergenin farklı piyasa ortamlarına uyum sağlamasını sağlar ve size hem netlik hem de hassasiyet sunar.
Ana Özellikler
Geliştirilmiş ADX Hesaplaması – Daha doğru ve uyarlanabilir trend gücü ölçümü için EMA veya KAMA düzeltmesi kullanır.
Net Görsel Sinyaller – Ayrı renk kodlaması (ADX için mavi/sarı, +DI için yeşil, –DI için kırmızı) yorumlamayı sezgisel hale getirir.
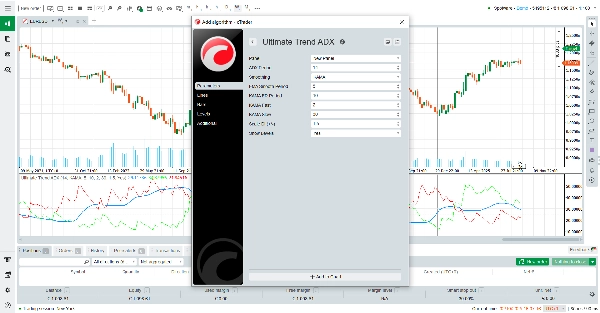
Ayarlanabilir Hassasiyet – Parametreler, ticaret tarzınıza uygun duyarlılığı ince ayar yapmanıza olanak tanır.
Yerleşik Yatay Seviyeler – Hızlı referans seviyeleri (0/25/50/75/100) trend yoğunluğunu anında değerlendirmenize yardımcı olur.
Neden Ultimate Trend ADX’i Seçmelisiniz?
Ticarette başarı genellikle bir piyasanın trendde olup olmadığını belirlemeye bağlıdır. Ultimate Trend ADX, klasik ADX’in güvenilirliğini, onu daha keskin, daha net ve daha uygulanabilir kılan modern geliştirmelerle birleştirerek size bu avantajı sağlar. Döviz, hisse senetleri, endeksler veya emtialar ticareti yapıyor olun, bu gösterge gürültüyü filtrelemenize, sinyalleri onaylamanıza ve hakim piyasa yönüyle uyumlu kalmanıza yardımcı olacaktır.
Özet
This indicator incorporates exponential moving average (EMA) or Kaufman’s adaptive moving average (KAMA) smoothing techniques to improve responsiveness and reduce noise. It also features a scaling factor for the +DI and –DI lines, enhancing signal visibility. Horizontal reference levels at 0, 25, 50, 75, and 100 assist in quickly assessing trend intensity.
Ultimate Trend ADX supports multiple markets including forex, stocks, indices, commodities, and cryptocurrencies. It is suitable for various trading strategies such as scalping, breakout, and grid trading. Adjustable sensitivity settings allow customization to fit different trading styles. This tool aids traders in identifying strong trends, spotting reversals, and confirming entry signals with improved clarity and precision.
Müşteri değerlendirmeleri
5 | 100 % | |
4 | 0 % | |
3 | 0 % | |
2 | 0 % | |
1 | 0 % |