
Daily Open Color Zones
Gösterge
346 i̇ndirmeler
Sürüm 1.0, Sep 2025
Windows, Mac
4.0
Değerlendirmeler: 1
Açıklama
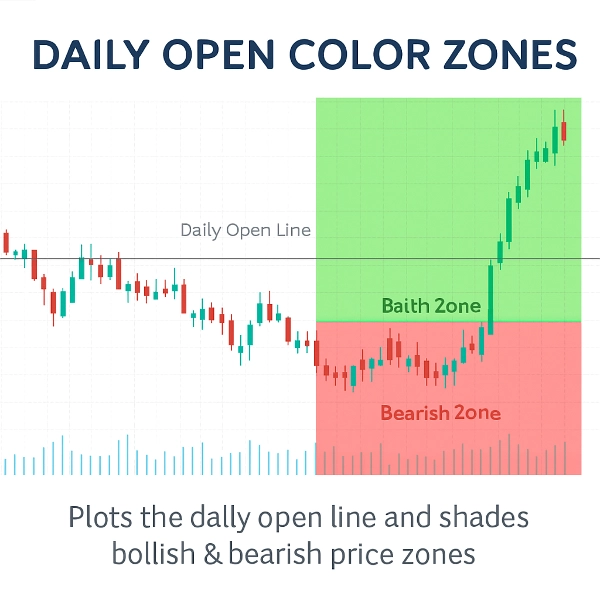
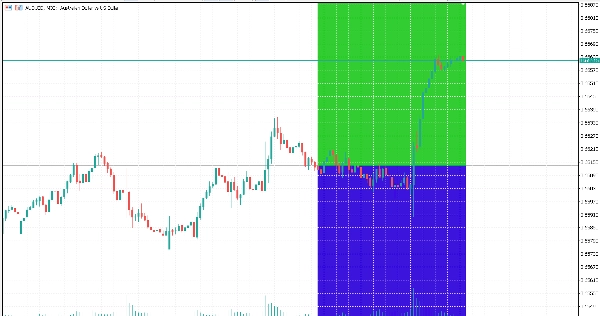
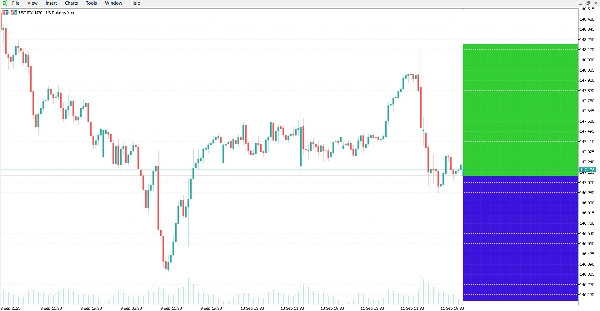
Bu gösterge, Günlük Açılış Çizgisini çizer ve etrafındaki yükseliş ve düşüş fiyat bölgelerini gölgelendirir.
Piyasanın günlük açılışın üzerinde mi yoksa altında mı işlem gördüğünü görmek için net bir görsel referans sağlar; bu, günlük içi analizde yaygın olarak kullanılan bir seviyedir.
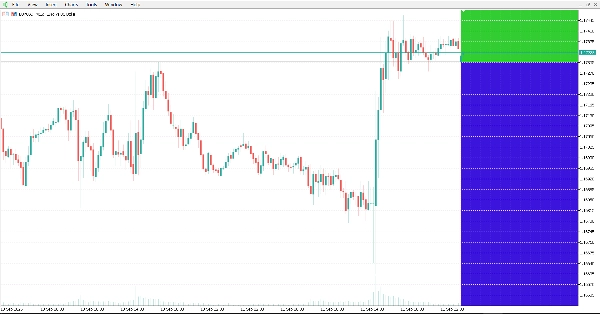
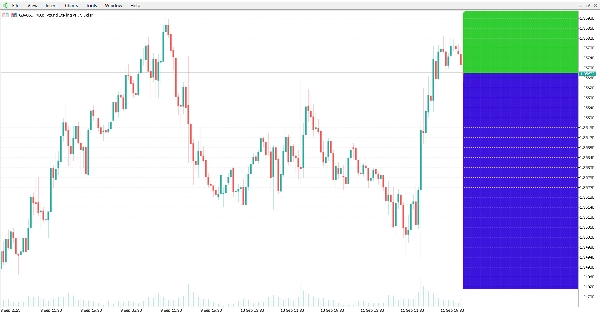
Gösterge, günlük açılış fiyatında otomatik olarak yatay bir çizgi çizer ve grafik alanlarını vurgular:
- Çizginin üzerindeki yeşil bölge (yükseliş alanı).
- Çizginin altındaki kırmızı bölge (düşüş alanı).
Özellikler:
- Otomatik Günlük Açılış Çizgisi: günlük açılış fiyatının hassas çizimi.
- Renkli Bölgeler: özelleştirilebilir renklerle yükseliş ve düşüş alanlarını kolayca ayırt edin.
- Dinamik Güncellemeler: bölgeler her yeni mumla otomatik olarak ayarlanır.
- Özelleştirilebilir görünüm: çizgi stili, kalınlığı ve bölge renkleri değiştirilebilir.
- Hafif ve verimli: minimum CPU kullanımı için tasarlanmıştır.
- Tüm semboller ve zaman dilimlerinde çalışır.
Sonuç:
Gösterge, günlük açılış ve ilgili yükseliş/düşüş bölgelerinin net bir grafik görselleştirmesini sunar. Teknik analiz için farklı piyasalara ve zaman dilimlerine uygulanabilir.
Özet
YZ özeti
The Daily Open Color Zones indicator visually marks the daily open price on trading charts by automatically plotting a horizontal line at this level. It shades the price area above the daily open line in green to indicate bullish zones and the area below in red to indicate bearish zones. These color-coded zones update dynamically with each new candle, providing real-time visual cues about market direction relative to the daily open. The indicator supports all symbols and timeframes, making it applicable across various markets including Forex, cryptocurrencies, and commodities like gold (XAUUSD). Users can customize the line style, thickness, and zone colors to suit their preferences. Designed to be lightweight, it minimizes CPU usage while offering clear intraday reference points commonly used in technical analysis and scalping strategies.
Gösterge profili
Müşteri değerlendirmeleri
4.0
Değerlendirmeler: 1
5 | 0 % | |
4 | 100 % | |
3 | 0 % | |
2 | 0 % | |
1 | 0 % |
Müşteri değerlendirmeleri
October 20, 2025
Clean and visual 🎨 - Daily Open Zones make trend bias crystal clear. Great tool for intraday planning and momentum entries!
Tartışma
SSS
Forex
Scalping
EURUSD
Crypto
Grid
XAUUSD
cTrader Store üzerinden erişilebilen işlem botları, göstergeler ve eklentiler gibi ürünler, üçüncü taraf sağlayıcılar tarafından sağlanır ve yalnızca bilgilendirme ve teknik erişim amaçlarıyla sunulur. cTrader Store bir broker değildir ve yatırım tavsiyesi, kişisel öneriler vermez veya gelecekteki performansı garanti etmez.


Fiyat
Başlangıç 13/09/2025
27
Satışlar
5.4K
Ücretsiz yüklemeler