
Açıklama
Osilatör Bollinger Bantları ile Gelişmiş Trend Dinamikleri
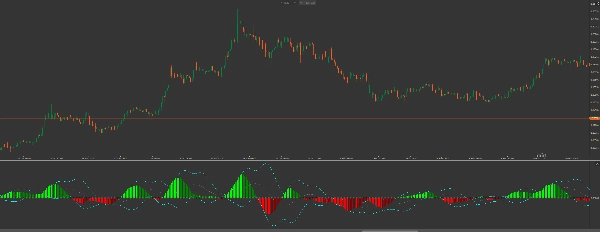
Squeeze Pro: Momentum & Volatility Suite, cTrader için kurumsal düzeyde bir araç setidir. Standart göstergelerin aksine, bu paket piyasa davranışının çift katmanlı analizini sunar: Sıkışma Fazını (piyasa sıkışması) tanımlar ve osilatörün kendisi üzerinde doğrudan hesaplanan Bollinger Bantları kullanarak Momentum Aşırılıklarını izler.
Temel Yenilikler
-
- Momentum Bollinger Bantları: Türünün ilk örneği. BB'leri momentum histogramına uygulayarak "aşırı alım" veya "aşırı satım" momentum seviyelerini belirleyebilirsiniz—trend tükenmeden önce çıkış zamanlaması için mükemmeldir.
- Üç Durumlu Sıkışma Tespiti:
-
- Siyah Noktalar (Sıkışma Açık): Yüksek sıkışma. Piyasa büyük bir kırılma için "sarılıyor".
- Gri Noktalar (Sıkışma Kapalı): Volatilite genişliyor. Hareket başladı.
- Mavi Noktalar (Sıkışma Yok): Normal piyasa koşulları.
- Doğrusal Regresyon Yumuşatma: Fiyat gürültüsünü filtrelemek için geliştirilmiş bir
CalculateLinearRegressionalgoritması kullanır ve pürüzsüz, güvenilir bir histogram sağlar. - Çift Katmanlı Mantık: Fiyat grafiğinizi temiz tutmak için ayrı bir gösterge penceresinde çalışır ve derin analitik içgörüler sunar.
Görsel Zeka Kılavuzu:
-
- Histogram (Trend & Güç)
-
- Lime: Boğa momentumu hızlanıyor (Güçlü Alım).
- Yeşil: Boğa momentumu yavaşlıyor (Kar Alımı).
- Kırmızı: Ayı momentumu hızlanıyor (Güçlü Satış).
- Kahverengi: Ayı momentumu yavaşlıyor (Satıcılar Tükenmiş).
- Osilatör Bantları ("Camgöbeği" Çizgiler)
-
- Histogram çubukları Camgöbeği Bollinger Bantlarının dışına çıktığında, mevcut trend istatistiksel bir aşırılıktadır. Histogram bu bantların içine geri çekilmeye başladığında dönüşler veya büyük geri çekilmeler bekleyin.
Ticaret Stratejisi: "Güçlü Kırılma"
-
- Sıkışmayı Tanımlayın: Sıfır çizgisinde Siyah Noktaların belirmesini bekleyin. Bu "fırtına öncesi sessizlik" anlamına gelir.
- Yönü Onaylayın: İlk Lime (Al) veya Kırmızı (Sat) histogram çubuğunu arayın.
- Tetikleyici: Enerjinin serbest bırakıldığını gösteren Sıkışma Kapalı (Gri nokta) göründüğünde işlemi başlatın.
- Çıkış: Histogram Lime'dan Yeşil'e döndüğünde YA DA histogram Osilatör Üst BB seviyesine ulaştığında kar alın, bu tükenmeyi işaret eder.
Neden Squeeze Pro’ya Yükseltmelisiniz?
Temel göstergeler size fiyatın nerede olduğunu gösterirken, Squeeze Pro hareketin arkasındaki baskıyı gösterir. Sıkışmayı ve momentum bantlarını aynı anda görerek, zaten tükenmiş trendlere girmekten kaçınır ve başkalarının kaçırdığı patlayıcı hareketleri yakalarsınız.
Geliştirici Notu: Bu gösterge, cTrader’ın API’si için yüksek derecede optimize edilmiştir, düşük donanımlı makinelerde bile performans gecikmesi olmadan gerçek zamanlı karmaşık doğrusal regresyon hesaplamalarını yönetir.
Özet
Key features include linear regression smoothing to reduce price noise, a dual-overlay display that keeps the price chart uncluttered, and a color-coded histogram that visually represents bullish and bearish momentum strength and changes. When histogram bars move outside the oscillator’s Bollinger Bands (cyan lines), it signals statistically extreme momentum levels, useful for timing entries and exits.
The indicator supports a "Power Breakout" trading strategy: traders wait for squeeze signals, confirm momentum direction via histogram colors, enter trades on squeeze release, and exit when momentum shows signs of exhaustion. This suite provides institutional-grade insights into trend pressure and momentum dynamics, helping traders identify potential explosive moves and avoid exhausted trends.
Müşteri değerlendirmeleri
5 | 0 % | |
4 | 100 % | |
3 | 0 % | |
2 | 0 % | |
1 | 0 % |


