
Mô tả
Trình Hiển Thị Hỗ Trợ & Kháng Cự Cấp Tổ Chức
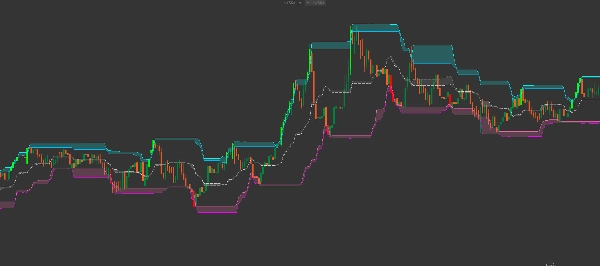
Smart Donchian Cloud Reversal là một kênh biến động thế hệ mới được thiết kế để xác định các vùng đảo chiều có xác suất cao. Khác với các Kênh Donchian tiêu chuẩn chỉ theo dõi các đỉnh cao nhất và đáy thấp nhất, chỉ báo này phân tích mối quan hệ giữa đuôi nến và thân nến để vẽ ra "Đám Mây Áp Lực."
Những đám mây này hoạt động như các vùng Cung và Cầu động, cho bạn thấy chính xác nơi thị trường có khả năng dừng lại hoặc đảo chiều.
Kiến Trúc Đa Đám Mây Tiên Tiến
Chỉ báo này có hệ thống đám mây 3 lớp tinh vi:
-
- Đám Mây Kháng Cự (Xanh Lơ/Xanh Dương): Nằm ở trên cùng, nó trực quan hóa khoảng cách giữa đuôi nến cao nhất và thân nến cao nhất. Đây là "Vùng Bán."
- Đám Mây Cân Bằng (Xám/Bạc): Một dải trung tâm theo dõi sự cân bằng của thị trường. Nó đại diện cho điểm giá trị công bằng giữa đuôi và thân nến.
- Đám Mây Hỗ Trợ (Hồng/Magenta): Nằm ở dưới cùng, nó trực quan hóa khoảng cách giữa đuôi nến thấp nhất và thân nến thấp nhất. Đây là "Vùng Mua."
Các Tính Năng Giao Dịch Chính
-
- Bộ Lọc Biến Động ATR: Bao gồm bộ nhân ATR (Average True Range) tích hợp để dịch chuyển nhẹ các dải ngoài, lọc bỏ nhiễu thị trường và các "bẫy dừng lỗ."
- Tô Màu Nến Thông Minh: Chỉ báo tự động làm nổi bật động lượng phá vỡ:
- Nến LIME: Giá đã đóng cửa trên Đám Mây Kháng Cự Trên (Phá vỡ tăng).
- Nến ĐỎ: Giá đã đóng cửa dưới Đám Mây Hỗ Trợ Dưới (Phá vỡ giảm).
- Logic Đuôi vs. Thân: Bằng cách nhìn vào độ dày của "đám mây", bạn có thể đánh giá biến động. Đám mây dày nghĩa là đuôi dài (từ chối cao/không quyết đoán), trong khi đám mây mỏng nghĩa là hành động giá mạnh mẽ, quyết đoán.
Cách Giao Dịch Với Đám Mây Donchian Thông Minh
1. Đảo Chiều Trung Bình (Scalping) » Tìm giá vào Đám Mây Kháng Cự mà không đóng cửa trên nó. Điều này thường báo hiệu một "giả phá," báo hiệu cơ hội vào lệnh short có xác suất cao trở lại Đường Giữa.
2. Phá Vỡ Xu Hướng » Khi một cây nến chuyển thành Lime (đóng cửa trên bộ lọc đuôi trên), nó báo hiệu rằng phe bò đã vượt qua vùng kháng cự. Đây là tín hiệu mạnh cho các chiến lược theo xu hướng.
3. Đáy Hỗ Trợ » Quan sát Đám Mây Hỗ Trợ (Hồng). Khi giá chạm vùng này trong đợt điều chỉnh của xu hướng tăng, nó đại diện cho khu vực "Mua Giá Trị" nơi các nhà đầu tư tổ chức thường tham gia.
Thông Số Kỹ Thuật
-
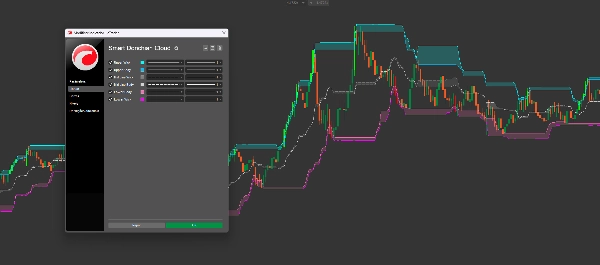
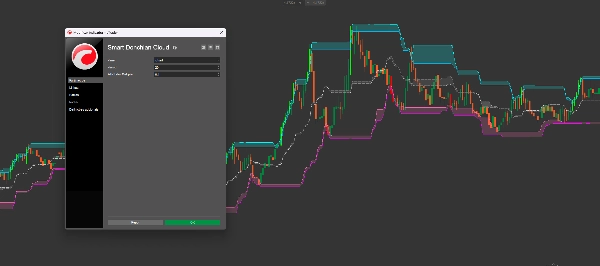
- Chu Kỳ: Chu kỳ nhìn lại để tính các đỉnh và đáy (Mặc định: 20).
- Bộ Nhân Bộ Lọc ATR: Điều chỉnh "đệm" xung quanh các cực trị để tránh bị ảnh hưởng bởi các đỉnh nhỏ.
- Màu Sắc Tùy Chỉnh Hoàn Toàn: Tùy chỉnh các đám mây Trên, Giữa và Dưới để phù hợp với mẫu biểu đồ cá nhân của bạn.
Tại Sao Công Cụ Này Lại Quan Trọng
Hầu hết các nhà giao dịch thất bại vì họ coi Hỗ Trợ và Kháng Cự như các đường đơn lẻ. Thực tế, chúng là Vùng. Smart Donchian Cloud Reversal lập bản đồ các vùng này một cách toán học, mang lại cho bạn bức tranh rõ ràng hơn về cấu trúc thị trường so với bất kỳ chỉ báo kênh truyền thống nào.
Tóm tắt
Đánh giá của khách hàng
5 | 100 % | |
4 | 0 % | |
3 | 0 % | |
2 | 0 % | |
1 | 0 % |


