
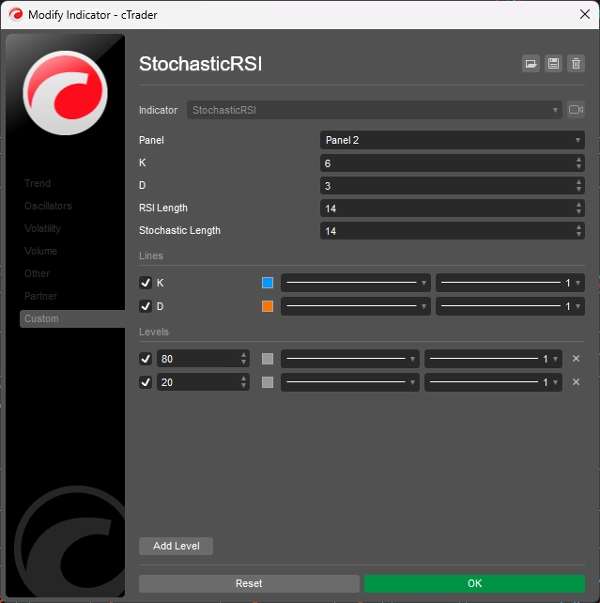
StochasticRSI
Indicateur
1.16K téléchargements
Version 1.0, Nov 2024
Windows, Mac
5.0
Avis : 1
Description
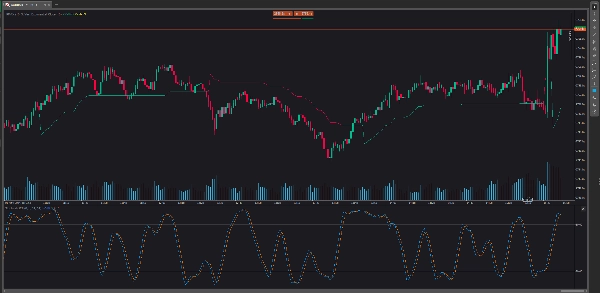
Le RSI stochastique (StochRSI) est un indicateur d'analyse technique utilisé pour soutenir la prédiction du marché boursier en comparant la fourchette de prix d'un titre à son prix de clôture. Le StochRSI est unique en ce qu'il se concentre sur le momentum du marché et est efficace pour détecter les conditions de marché surachetées et survendues. Le StochRSI diffère des autres indicateurs techniques, tels que l'indice de force relative (RSI), car il passe des prix surachetés aux prix survendus plus rapidement que le RSI.
Résumé
Résumé IA
Stochastic RSI (StochRSI) is a technical analysis indicator designed to assess market momentum by comparing a security's price range to its closing price. It is used primarily to identify overbought and oversold conditions in stock markets, providing faster signals than the traditional Relative Strength Index (RSI). Unlike RSI, StochRSI moves more rapidly between overbought and oversold levels, making it useful for traders seeking timely momentum insights. This indicator supports analysis across various indices and is categorized under momentum indicators, specifically related to RSI.
Profil de l'indicateur
Avis clients
5.0
Avis : 1
5 | 100 % | |
4 | 0 % | |
3 | 0 % | |
2 | 0 % | |
1 | 0 % |
Avis clients
July 9, 2025
Pros: Combines Stochastic Oscillator and RSI for improved overbought/oversold detection. Easy to set up, stable on all timeframes. Cons: No tooltips or alerts. Requires confirmation from trend indicators to avoid false signals. Limited customization options.
Discussion
Questions fréquentes
Indices
RSI
Les produits disponibles sur cTrader Store, notamment les bots de trading, les indicateurs et les plug-ins, sont fournis par des développeurs tiers et mis à disposition à titre informatif et à des fins d'accès technique uniquement. cTrader Store n'est pas un courtier et ne fournit aucun conseil en investissement, aucune recommandation personnelle ni aucune garantie quant aux performances futures.
Plus de cet auteur


Prix
2
Ventes
6.92K
Installations gratuites