الوصف
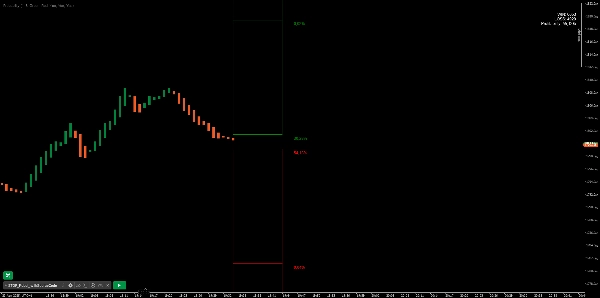
احتمالية الاختراق هي مؤشر قيم يحسب احتمال حدوث قمة أو قاع جديد ويعرضه كمستوى مع نسبته المئوية. يتم اختبار احتمال القمة والقاع الجديدين تاريخياً، وتُعرض النتائج في جدول— طريقة بسيطة لفهم احتمال الشمعة التالية في تحقيق قمة أو قاع جديد. بالإضافة إلى ذلك، يعرض المؤشر أربعة مستويات إضافية فوق وتحت الشمعة مع احتمال الوصول إلى هذه المستويات.
يساعد المؤشر المتداولين على فهم احتمال اتجاه الشمعة التالية، والذي يمكن استخدامه لتحديد تحيز التداول الخاص بك.
█ الحسابات
يقوم الخوارزم بحساب جميع الشموع الخضراء والحمراء بشكل منفصل اعتمادًا على ما إذا كانت الشمعة السابقة حمراء أو خضراء ويمنح درجات إذا تم الوصول إلى خط واحد أو أكثر. ثم يحسب الخوارزم عدد الشموع التي وصلت إلى تلك المستويات في التاريخ ويعرضها كقيمة مئوية على كل خط.
█ مثال
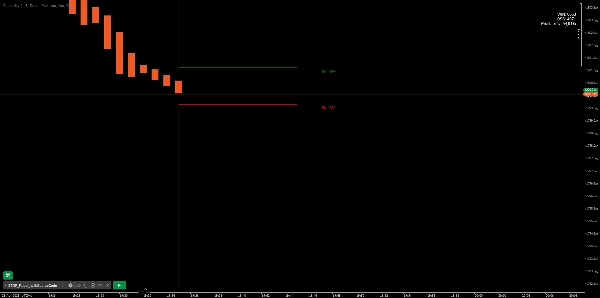
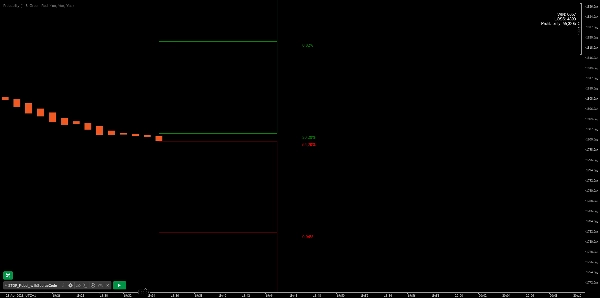
في هذا المثال، كانت الشمعة السابقة خضراء؛ يمكننا أن نرى أن القمة الجديدة تم الوصول إليها بنسبة 72.82% من الوقت والقاع بنسبة 28.29% فقط. في هذه الحالة، تم تحقيق قمة جديدة.
الملخص
تقييمات العملاء
5 | 100 % | |
4 | 0 % | |
3 | 0 % | |
2 | 0 % | |
1 | 0 % |