
FairValueGap
مؤشر
2.15K التنزيلات
الإصدار 1.0، Apr 2025
Windows, Mac
4.5
التقييمات: 2
الوصف
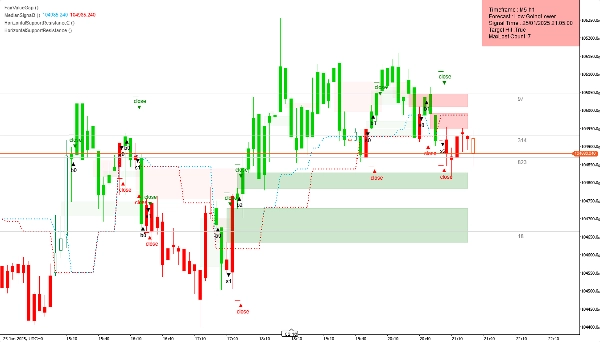
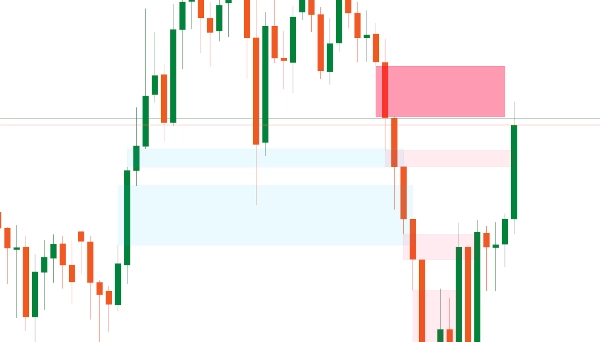
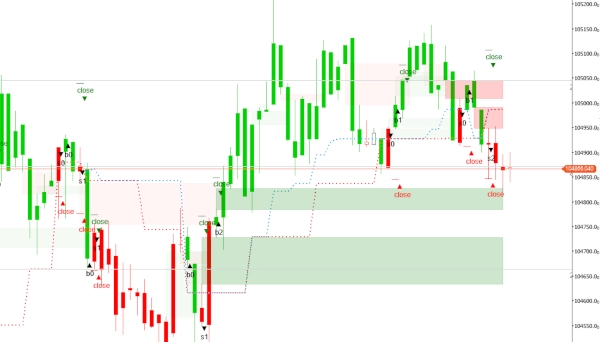
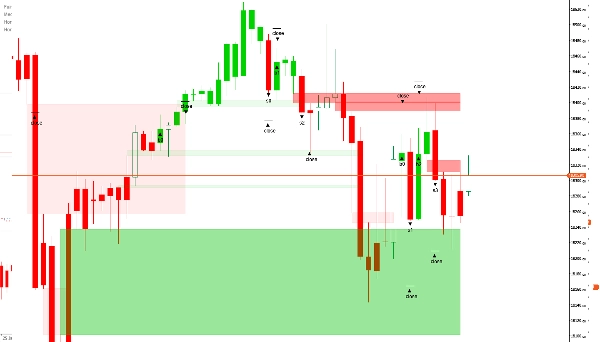
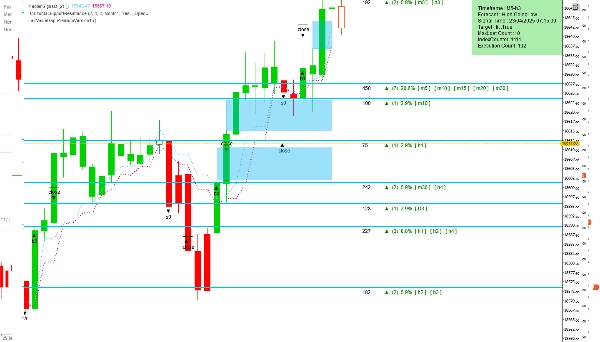
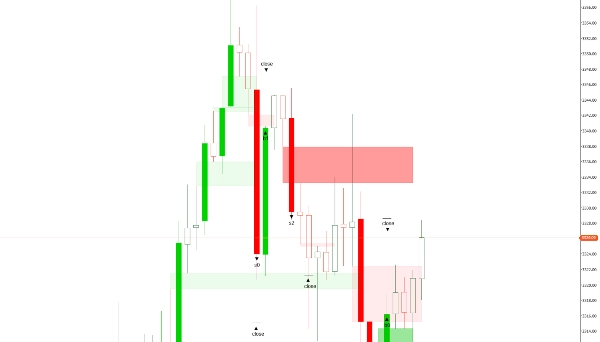
مؤشر فجوة القيمة العادلة (FVG) هو أداة تحليل فني مصممة لتحديد اختلالات الأسعار المحتملة في السوق. تحدث هذه الفجوات عندما يتحرك السعر بسرعة، مما يخلق منطقة بها نشاط تداول ضئيل - غالبًا ما يُشار إليها باسم "فراغ". قد تشير هذه الاختلالات إلى احتمال ارتداد السعر، حيث يميل السوق إلى البحث عن التوازن من خلال إعادة زيارة هذه المناطق.
نظرة عامة على الإعدادات
- الأشرطة للتحميل: يحدد عدد الأشرطة التاريخية التي سيتم تحليلها، بدءًا من الأشرطة المكتملة حديثًا والتحرك إلى الوراء.
- لون فجوة القيمة العادلة الصاعدة: يحدد اللون للفجوات التي تظهر في اتجاه صاعد. يتم تطبيق شفافية بنسبة 30٪ بحيث تظل العناصر خلف الفجوة مرئية.
- لون فجوة القيمة العادلة الهابطة: يحدد اللون للفجوات التي تظهر في اتجاه هابط، أيضًا مع شفافية 30٪ لتحسين رؤية الرسم البياني.
الميزات المميزة (متوفرة في النسخة المدفوعة)
- حذف الفجوات المغلقة: إعداد منطقي—عند التفعيل ("نعم")، يقوم تلقائيًا بإزالة جميع الفجوات المغلقة؛ وإذا تم تعطيله ("لا")، تظل الفجوات مرئية. هذا مفيد بشكل خاص في الأطر الزمنية الأقل (أقل من 20 دقيقة).
- تعديل/إزالة الفجوات: يسمح للمتداولين بضبط أو حذف الفجوات يدويًا. هذا يمنح المتداولين ذوي الخبرة سيطرة أكبر، خاصة وأن الفجوات الصغيرة جدًا عادةً ما تقدم تأثيرًا ضئيلًا على حركة السعر.
- تعيين الإطار الزمني: يقدم خيارين—استخدام الإطار الزمني الحالي للرسم البياني أو اختيار إطار زمني مختلف للتحليل، مع عرض النتائج على الرسم البياني الرئيسي. تساعد هذه الميزة المتداولين على الحصول على رؤى أسرع حول تحركات السوق المحتملة.
- الإطار الزمني المختار: يحدد الإطار الزمني المرغوب للتحليل إذا تم اختيار "الإطار الزمني المختار" في الإعداد أعلاه.
- دقة الفجوات الصغيرة: يسمح للمتداولين بإدخال حجم الفجوة المفضل كعدد صحيح، مما يساعدهم على تحديد الفجوات التي تؤدي تاريخيًا إلى نتائج إيجابية. القيمة تعتمد على مجموعة البيانات الكاملة وأحجام الفجوات المرصودة للأصل.
بشكل افتراضي، يقوم المؤشر بمسح جميع الاختلالات ضمن إطار زمني واحد. ومع ذلك، يمكن للوصول إلى الميزات المميزة من خلال نسخة FairValueGapPremium تعزيز القدرات التحليلية بشكل كبير.
الملخص
ملخص الذكاء الاصطناعي
The Fair Value Gap (FVG) indicator is a technical analysis tool that identifies potential price imbalances in the market. These imbalances, or "gaps," occur when price moves rapidly, creating zones with minimal trading activity, often called "voids." Such areas may signal likely price retracements as the market tends to revisit these zones to restore balance.
Key settings include:
- Bars To Load: number of historical bars analyzed from the most recent backward.
- Bullish FVG Color: customizable color for gaps in uptrends with 30% transparency.
- Bearish FVG Color: customizable color for gaps in downtrends with 30% transparency.
Premium features (available in the paid version) enhance functionality by allowing:
- Automatic deletion of closed gaps, useful for lower timeframes.
- Manual editing or removal of gaps for finer control.
- Selection of analysis timeframe independent of the chart’s timeframe.
- Input of preferred gap size to improve identification accuracy based on historical data.
By default, the indicator scans imbalances within a single timeframe, with premium options providing expanded analytical capabilities.
ملف تعريف المؤشر
تقييمات العملاء
4.5
التقييمات: 2
5 | 50 % | |
4 | 50 % | |
3 | 0 % | |
2 | 0 % | |
1 | 0 % |
تقييمات العملاء
August 12, 2025
Pros: Automatically highlights the first session FVG and extends it to session end. Clean, minimal interface ideal for intraday analysis. Cons: No alerts or tooltips. Cannot save templates or track past session gaps.
August 6, 2025
مناقشة
الأسئلة الشائعة
يتم توفير المنتجات المتاحة من خلال cTrader Store، بما في ذلك روبوتات التداول والمؤشرات والإضافات، من قبل مطوري الطرف الثالث وإتاحتها لأغراض الوصول المعلوماتي والفني فقط. cTrader Store ليس وسيطًا ولا يقدم نصائح استثمارية أو توصيات شخصية أو أي ضمان للأداء المستقبلي.


السعر
منذ 19/04/2025
284.21M
حجم التداول
1.08M
الربح بالبيب
8
المبيعات
3.46K
التثبيتات المجانية