مؤشر
Indices
Stocks
Forex
GBPUSD
Scalping
HorizontalSupportResistance
شعار "HorizontalSupportResistance"
4.5
03/09/2025
354
Desktop
منذ 19/04/2025
حجم التداول
284.2M
الربح بالبيب
1.07M
المبيعات
7
التثبيتات المجانية
1430
صورة "HorizontalSupportResistance" المحملةصورة "HorizontalSupportResistance" المحملةصورة "HorizontalSupportResistance" المحملةصورة "HorizontalSupportResistance" المحملةصورة "HorizontalSupportResistance" المحملةصورة "HorizontalSupportResistance" المحملة

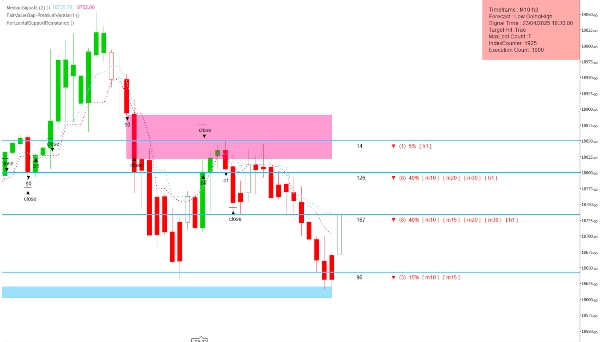
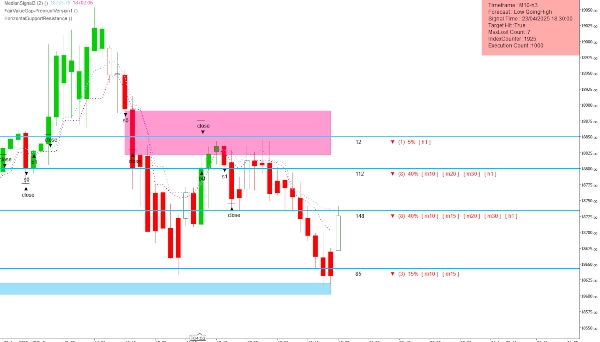
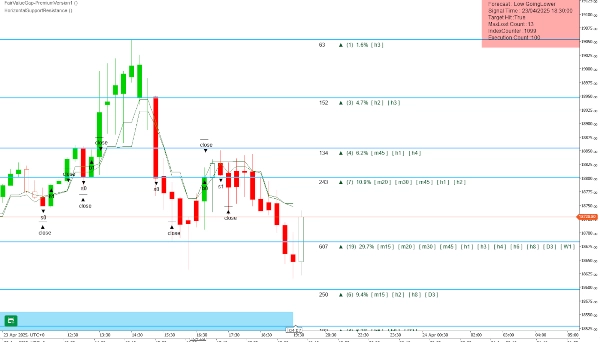
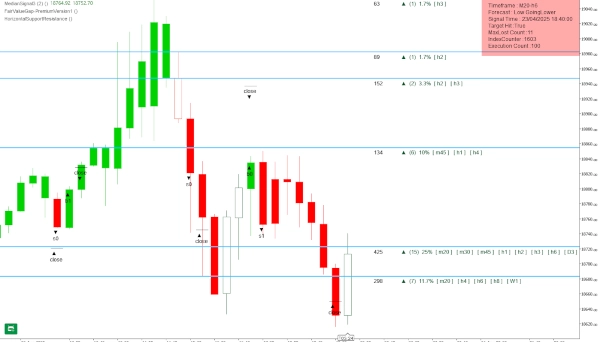
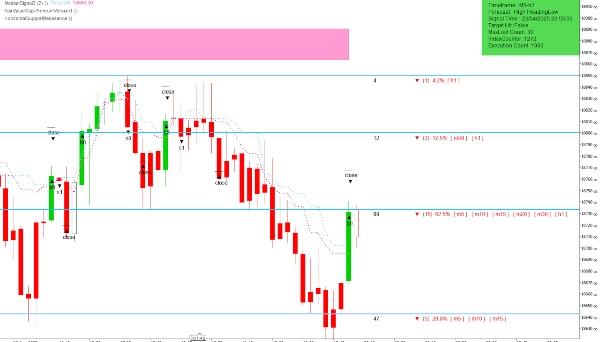
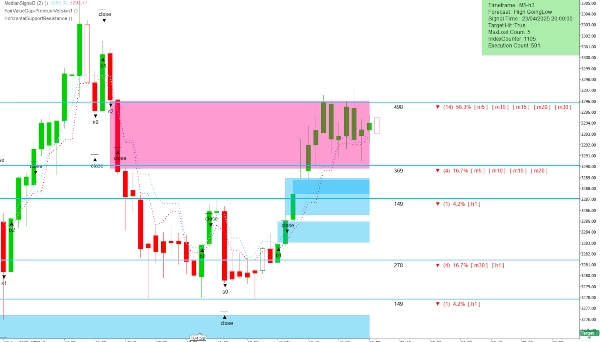
This extraordinary multi timeframe support and resistance indicator is nothing short of market wizardry. Designed with precision and backed by smart logic, it identifies critical price levels on all forex, indices, or stocks but especially on the NASDAQ100 with uncanny accuracy. Like a seasoned trader’s intuition encoded into a visual tool, it highlights key zones where price reacts, reverses, or accelerates—giving you an edge that feels almost supernatural. With clean candlestick representation and vibrant, clearly marked levels, this indicator doesn’t just follow the market—it anticipates it. Whether you're scalping short-term moves or holding longer-term positions, this tool acts like your personal trading oracle, quietly guiding you to smarter, more confident decisions.

4.5
التقييمات: 2
5
50 %
4
50 %
3
0 %
2
0 %
1
0 %
تقييمات العملاء
August 12, 2025
Pros: Accurate auto SR levels, customizable appearance, lightweight. Cons: No level strength filter, no alerts, possible chart clutter.
June 20, 2025
The Indicator is excellent, What's the core logic of this Indicator, Kindly share if you don't mind.
المزيد من هذا المؤلف
الأعلى تقييمًا
مجاني
FairValueGap
This Fair Value Gap (FVG) indicator is a technical analysis tool used to identify potential price imbalances.
مؤشر
Signal
FairValueGap-PremiumVersion1
This Fair Value Gap (FVG) indicator is a technical analysis on multi-timeframe.
الأعلى تقييمًا
مجاني
BarSentiments
This Indicator is a technical analysis tool that measures the strength and direction of market sentiment
قد يعجبك أيضًا
Renko 4k Pips
Custom your Renko Brick how do you wish!
Zigzag T3
Three ZigZag lines
BWMFI_Visual
BW_MFI Vizual colors bars
مؤشر
Forex
EURUSD
EconomicForex
ECONOMIC FOREX:provides insights into inflation, nominal interest rates and real interest rates, in the line chart
مؤشر
Grid
NAS100
NZDUSD
+16
AllPattern
🔍 Discover All Candlestick Patterns… Absolutely Free!
مؤشر
Indices
Commodities
Stocks
+2
XY Bar Info Panel v1.5
Overlay panel showing bar date/time, OHLC, tick Volume, percent change, and market session - fully customizable.
Candle Timer & Strength Demo
Candle Timer & Strength DEMO for cTrader This is a DEMO version of the Candle Timer & Strength indicator. You can use al
RSI Divergence Pro
This an RSI Divergence indicator which fulfill seller's need.
VegaXLR - cTrader Multi-Timeframe Pivot Pro
Customizable multi-timeframe pivot point indicator for cTrader with alerts, Fibonacci, CPR, and more!
مؤشر
VWAP
XAUUSD
Forex
+2
Dynamic Swing Anchored VWAP
MTF Candle Window - On Chart
The Multi-Timeframe Candle Indicator displays candles from multiple timeframes in one window, enhancing market analysis!
Bars color 1
This is the first version I offer you for free.
مؤشر
NAS100
NZDUSD
RSI
+12
TrendFibonacci
The TrendFibonacci indicator is a powerful tool for traders, combining Fibonacci retracement levels
مؤشر
NZDUSD
Forex
EURUSD
+2
4 RCS Relative Strength w Alerts_NSC
Forex Strength Meter for cTrader: 4 custom currencies, cross alerts, visual arrows. Trade smarter!
Fury Team E_M_A_su_TF
EMA ON TF (MULTI-TIMEFRAME)
Multi_TF Candlestick Chart Overlay
Perfect for traders who demand a clear overview of multiple timeframes at a glance.
True Trend H4
It draws a step line that visualize the movement of H4. Particularly effective when trade on lower timeframe.
Renko Moving Average Cross Indicator
The Renko Moving Average Cross indicator combines classic EMA crossover signals with Renko-filtered prices.