BarSentiments
"BarSentiments" logo
5.0
03/09/2025
283
Desktop
"BarSentiments" uploaded image"BarSentiments" uploaded image"BarSentiments" uploaded image"BarSentiments" uploaded image

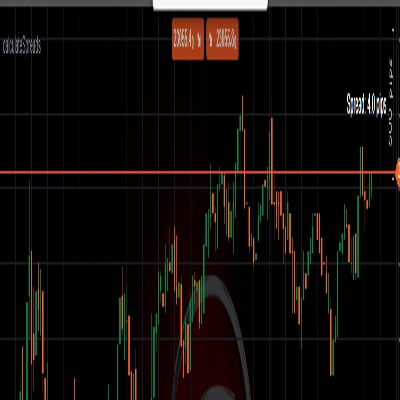
This Bar Sentiments Chart Indicator is a technical analysis tool that measures the strength and direction of market sentiment on a bar-by-bar (or candlestick-by-candlestick) basis. It examines the relationship between each bar’s open, high, low, and close prices to determine whether the market exhibited bullish, bearish, or neutral behavior during that time period.

Typically, a bullish sentiment is identified when the close price finishes significantly higher than the open, indicating strong buying pressure. A bearish sentiment is detected when the close is notably lower than the open, signaling strong selling pressure. Neutral bars, often called "dojis," reflect indecision or balance between buyers and sellers.

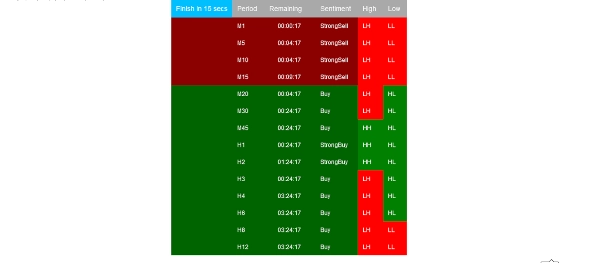
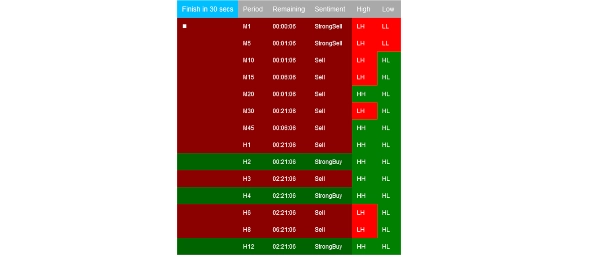
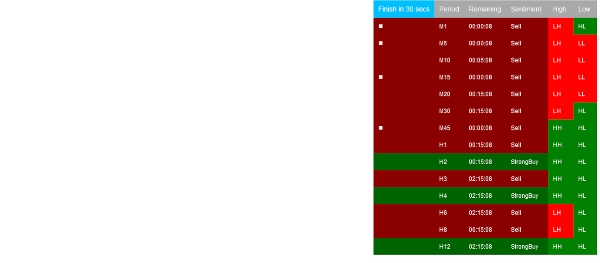
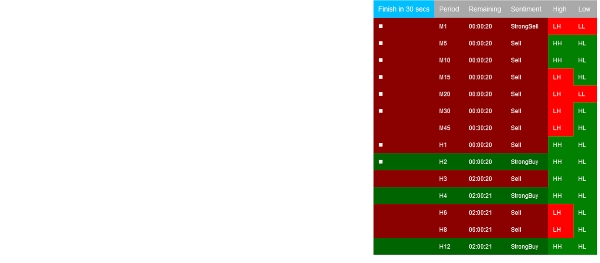
Advanced versions of the Bar Sentiments Indicator may incorporate additional elements such as volume, relative body size, or momentum to refine the sentiment classification. Sentiments are often visualized through color-coding—green for bullish, red for bearish, and gray or blue for neutral—making it easy to quickly assess the prevailing market tone.

If 1s and 0s are the building blocks of software engineering, then the output of the Bar Sentiments Chart Indicator represents the fundamental building blocks of advanced machine learning trading systems. By quantifying raw market sentiment, it provides essential inputs for algorithms that seek to learn and predict future price movements based on historical behavior.

Using the Bar Sentiments Chart Indicator, traders gain a deeper understanding of micro market dynamics, helping them identify trend strength, potential reversals, and consolidation periods—especially when combined with multi-timeframe analysis and other technical tools.

5.0
Reviews: 2
5
100 %
4
0 %
3
0 %
2
0 %
1
0 %
Customer reviews
August 18, 2025
Pros: Simple and effective bar sentiment visualization. Lightweight and works on all timeframes. Useful for scalping and intraday trading. Cons: No alerts, MTF mode, or preset saving. Limited integration with other tools.
July 8, 2025
Great Tool Nardo. It would be great to have this same graphic visualisation in a cTrader plugin, in orden to free chart space and having the table on the side (right column of the platform, under the New Order section)
More from this author
Top-rated
Free
FairValueGap
This Fair Value Gap (FVG) indicator is a technical analysis tool used to identify potential price imbalances.
Indicator
Signal
FairValueGap-PremiumVersion1
This Fair Value Gap (FVG) indicator is a technical analysis on multi-timeframe.
Indicator
Indices
Stocks
Forex
+2
HorizontalSupportResistance
This extraordinary multi-timeframe support and resistance indicator is nothing short of market wizardry.
You may also like
Indicator
Stocks
Forex
Crypto
PinBarCandlestickPattern
PinBarCandlestickPattern Indicator
Indicator
Breakout
XAUUSD
Commodities
CursorByte.SupportResistance v3
Draws support and resistance on all pairs. Multi-timeframe support.
Indicator
NAS100
NZDUSD
Martingale
+22
Zigzag Trend
The ZigZag Trend is a market structure tool that filters out small price fluctuations and highlights major swing.
Fisher_m11
Fisher Transform with smoothing. Spot reversals and cycles with precision. Great for any market, any timeframe.
Laguerre RSI
Laguerre RSI is based on John EHLERS' Laguerre Filter to avoid the noise of RSI.
Indicator
NAS100
NZDUSD
XAUUSD
+16
Candle Timer Toolbox
A multi-TF panel with candle timers, sessions, ticker, spread & 15+ themes. Fully customizable.
E7 Volume Profile
E7 Volume Profile, more modern look and feel.
Indicator
Forex
EURUSD
USDJPY
4 Currencies V2_NSC
Relative Currency Strength 4 Currencies: AUD USD EUR JPY
Block Order Rreversal
Order BlockIndicator reversal
Indicator
Indices
Breakout
Prop
+5
Squeeze Momentum Indicator 2.0version
Squeeze Momentum Indicator detects market consolidation periods and momentum breakouts using Bollinger Bands.
Indicator
Indices
Stocks
Commodities
+2
DayOfWeek - FXMaster
Day of Week Indicator for cTrader
Indicator
VWAP
Indices
Prop
+4
LT_Ind_VWAP
Multi-anchor VWAP indicator for cTrader. Plots two VWAP lines (red and blue) with selectable anchors.
Time To Break Even Indicator v2
Time To Break Even Indicator. This indicator helps you time your trade's entry.
Indicator
Indices
XAUUSD
Commodities
+8
ATR on Chart
Plots the ATR on the chart for easy visualization.
Indicator
Breakout
PDHL
PDHL - Previous Day High&Low
Indicator
NAS100
RSI
NZDUSD
+16
AlphaTrend Pro Max
Turn data into precision trades with AlphaTrend Pro Max — advanced trend, signal & structure analysis in one.
Indicator
RSI
Breakout
XAUUSD
+4
Dynamic Market Structure Analysis of Turning Points
Identify market structure effortlessly with swing highs, lows, CHoCH, and BOS levels for smart trading decisions! 📊🔍"
Indicator
NAS100
NZDUSD
XAUUSD
+7
Bayesian Price Projection Model
Bayesian theory** to forecast a future price while providing **uncertainty ranges** that represent upper and lower bound