
FairValueGap
Indicator
2.15K downloads
Version 1.0, Apr 2025
Windows, Mac
4.5
Reviews: 2
Description
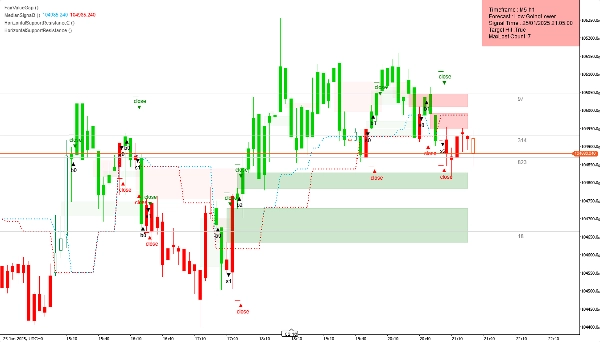
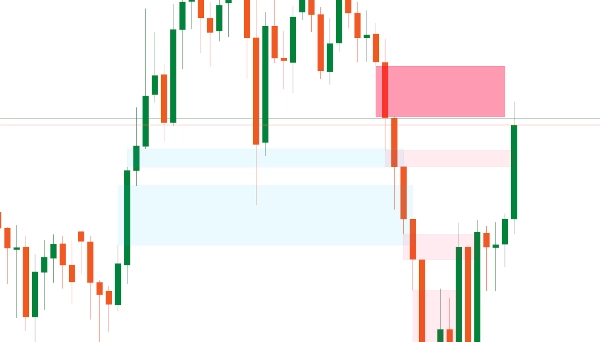
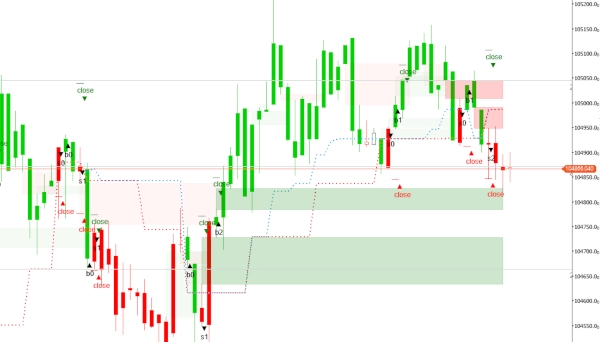
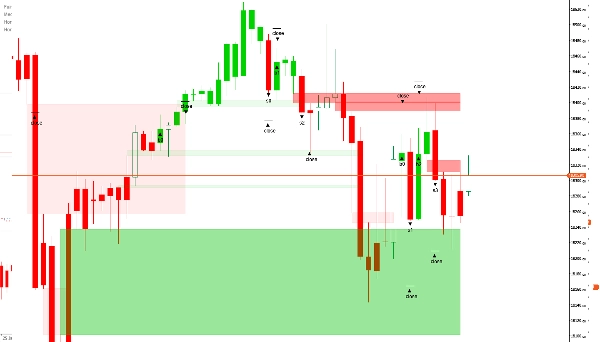
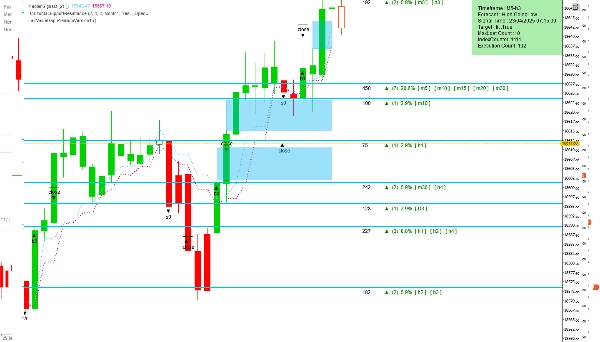
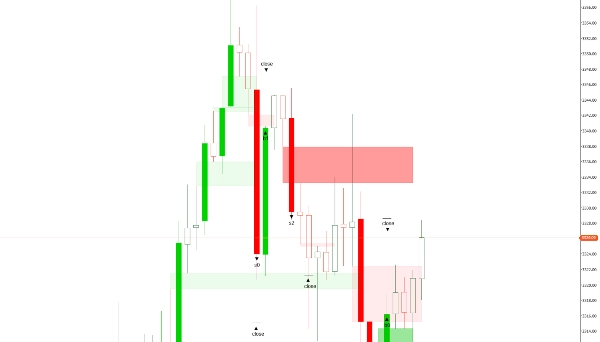
The Fair Value Gap (FVG) indicator is a technical analysis tool designed to pinpoint potential price imbalances in the market. These gaps occur when the price moves rapidly, creating a zone with minimal trading activity—often referred to as a "void." Such imbalances may indicate a likelihood of price retracement, as the market tends to seek balance by revisiting these areas.
Settings Overview
- Bars To Load: Specifies the number of historical bars to analyze, starting from the most recently completed one and moving backward.
- Bullish FVG Color: Sets the color for FVGs that appear in an uptrend. A 30% transparency is applied so that elements behind the gap remain visible.
- Bearish FVG Color: Sets the color for FVGs that appear in a downtrend, also with 30% transparency for better chart visibility.
Premium Features (Available in the Paid Version)
- Delete Closed Gaps: A Boolean setting—when enabled ("yes"), it automatically removes all closed gaps; if disabled ("no"), the gaps remain visible. This is particularly useful on lower timeframes (under 20 minutes).
- Edit/Remove Gaps: Allows traders to adjust or delete gaps manually. This gives experienced traders greater control, especially since very small gaps typically offer little influence on price movement.
- Set Timeframe: Offers two options—use the current chart's timeframe or select a different one for analysis, while still displaying results on the main chart. This feature helps traders gain faster insights into probable market movements.
- Selected Timeframe: Specifies the desired timeframe for analysis if "Selected Timeframe" is chosen in the setting above.
- Small Gap Accuracy: Lets traders input a preferred gap size as an integer, helping them identify gaps that historically lead to favorable outcomes. The value is based on the entire dataset and gap sizes observed for the asset.
By default, the indicator scans all imbalances within a single timeframe. However, access to premium features through the FairValueGapPremium version can greatly enhance analytical capabilities.
Summary
AI summary
The Fair Value Gap (FVG) indicator is a technical analysis tool that identifies potential price imbalances in the market. These imbalances, or "gaps," occur when price moves rapidly, creating zones with minimal trading activity, often called "voids." Such areas may signal likely price retracements as the market tends to revisit these zones to restore balance.
Key settings include:
- Bars To Load: number of historical bars analyzed from the most recent backward.
- Bullish FVG Color: customizable color for gaps in uptrends with 30% transparency.
- Bearish FVG Color: customizable color for gaps in downtrends with 30% transparency.
Premium features (available in the paid version) enhance functionality by allowing:
- Automatic deletion of closed gaps, useful for lower timeframes.
- Manual editing or removal of gaps for finer control.
- Selection of analysis timeframe independent of the chart’s timeframe.
- Input of preferred gap size to improve identification accuracy based on historical data.
By default, the indicator scans imbalances within a single timeframe, with premium options providing expanded analytical capabilities.
Indicator profile
Customer reviews
4.5
Reviews: 2
5 | 50 % | |
4 | 50 % | |
3 | 0 % | |
2 | 0 % | |
1 | 0 % |
Customer reviews
August 12, 2025
Pros: Automatically highlights the first session FVG and extends it to session end. Clean, minimal interface ideal for intraday analysis. Cons: No alerts or tooltips. Cannot save templates or track past session gaps.
August 6, 2025
Discussion
FAQ
Products available through cTrader Store, including trading bots, indicators and plugins, are provided by third-party developers and made available for informational and technical access purposes only. cTrader Store is not a broker and does not provide investment advice, personal recommendations or any guarantee of future performance.


Price
Since 19/04/2025
284.21M
Traded volume
1.08M
Pips won
8
Sales
3.46K
Free installs