
Order Block Finder
مؤشر
1.97K التنزيلات
الإصدار 1.0، May 2025
Windows, Mac
5.0
التقييمات: 2
الوصف
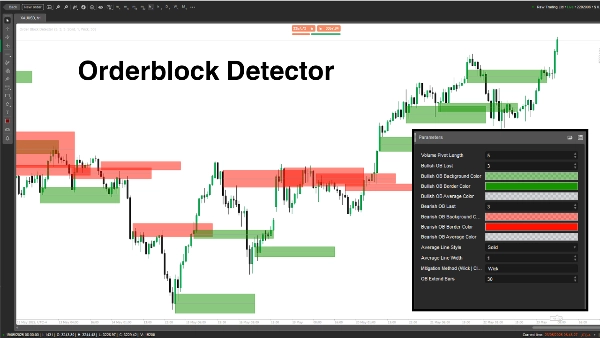
مؤشر "كاشف كتل الأوامر" مصمم لاكتشاف وعرض كتل الأوامر (OBs) على مخطط السعر — مناطق رئيسية حيث يضع اللاعبون الكبار (المؤسسات) أوامر شراء أو بيع كبيرة، مما يؤدي غالبًا إلى ردود فعل سعرية قوية. يساعد هذا المؤشر المتداولين على تحديد مناطق الدعم/المقاومة المحتملة لدخول صفقات أذكى، أو تحديد وقف الخسارة، أو جني الأرباح.
المفهوم
- كتل الأوامر: هي مناطق سعرية حيث يعكس السوق اتجاهه أو يتوقف بسبب تدفق أوامر مؤسسية كثيفة. يكتشف المؤشر كتل الأوامر من خلال تحليل قمم حجم التداول المحورية وحالة السوق (صاعدة/هابطة).
- كيف يعمل:
-
- يحدد حالة السوق (صاعدة/هابطة) بمقارنة القمم/القيعان بفترة نظر إلى الوراء (الطول).
- يحدد كتل الأوامر عند قمم الحجم المرتبطة بمستويات سعرية رئيسية.
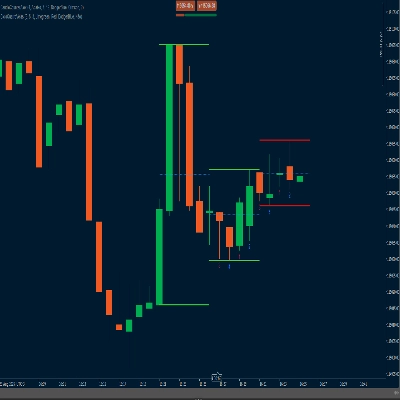
- يرسم مستطيلات وخطوط متوسطة لتحديد كتل الأوامر، مع التحقق وإزالة كتل الأوامر المخففة عند اختراق السعر.
- حالة الاستخدام: يمكن للمتداولين استخدام كتل الأوامر كمناطق ذات احتمالية عالية لإعداد الصفقات، إدارة المخاطر، أو أهداف الربح.
تفصيل المعلمات
- طول محور الحجم (Length، الافتراضي: 5، الحد الأدنى: 1)
-
- ما يفعله: يحدد فترة النظر إلى الوراء (عدد الأعمدة) لحساب القمم/القيعان وقمم حجم المحور.
- لماذا هو مهم: يزيد الطول الأكبر الدقة لكنه يقلل من تكرار كتل الأوامر؛ الطول الأقصر يلتقط المزيد من كتل الأوامر لكنه قد يشمل ضوضاء.
- آخر كتلة أوامر صاعدة (BullExtLast، الافتراضي: 3، الحد الأدنى: 1)
-
- ما يفعله: يحدد عدد كتل الأوامر الصاعدة المخزنة والمتتبعة.
- لماذا هو مهم: يحد من عدد كتل الأوامر الصاعدة المعروضة للحفاظ على نظافة المخطط وتحسين الأداء.
- لون خلفية كتلة الأوامر الصاعدة (BgBullCss، الافتراضي: #80169400)
-
- ما يفعله: يحدد لون الخلفية وشفافية مستطيلات كتل الأوامر الصاعدة.
- لماذا هو مهم: يساعد في التمييز البصري لكتل الأوامر الصاعدة على المخطط.
- لون حدود كتلة الأوامر الصاعدة (BullCss، الافتراضي: #169400)
-
- ما يفعله: يحدد لون حدود مستطيلات كتل الأوامر الصاعدة.
- لماذا هو مهم: يعزز وضوح مناطق كتل الأوامر الصاعدة.
- لون متوسط كتلة الأوامر الصاعدة (BullAvgCss، الافتراضي: #609598A1)
-
- ما يفعله: يلون الخط المتوسط داخل كتل الأوامر الصاعدة.
- لماذا هو مهم: يحدد منتصف كتلة الأوامر، ويعمل كمستوى مرجعي رئيسي للمتداولين.
- آخر كتلة أوامر هابطة (BearExtLast، الافتراضي: 3، الحد الأدنى: 1)
-
- ما يفعله: يحدد عدد كتل الأوامر الهابطة المخزنة والمتتبعة.
- لماذا هو مهم: مثل BullExtLast، يحافظ على نظافة المخطط من خلال تحديد عدد كتل الأوامر الهابطة.
- لون خلفية كتلة الأوامر الهابطة (BgBearCss، الافتراضي: #80FF1100)
-
- ما يفعله: يحدد لون الخلفية وشفافية مستطيلات كتل الأوامر الهابطة.
- لماذا هو مهم: يميز كتل الأوامر الهابطة عن الصاعدة.
- لون حدود كتلة الأوامر الهابطة (BearCss، الافتراضي: #FF1100)
-
- ما يفعله: يحدد لون حدود مستطيلات كتل الأوامر الهابطة.
- لماذا هو مهم: يجعل كتل الأوامر الهابطة بارزة للتعرف السريع.
- لون متوسط كتلة الأوامر الهابطة (BearAvgCss، الافتراضي: #609598A1)
-
- ما يفعله: يلون الخط المتوسط داخل كتل الأوامر الهابطة.
- لماذا هو مهم: يبرز المستوى السعري المركزي لكتل الأوامر الهابطة لتخطيط الصفقات.
- نمط الخط المتوسط (LineStyle، الافتراضي: صلب)
-
- ما يفعله: يحدد نمط خط المتوسط لكتل الأوامر (صلب، متقطع، منقط).
- لماذا هو مهم: يخصص مظهر الخط المتوسط ليناسب تفضيلات المتداول.
- عرض الخط المتوسط (LineWidth، الافتراضي: 1، الحد الأدنى: 1)
-
- ما يفعله: يضبط سمك خط المتوسط لكتل الأوامر.
- لماذا هو مهم: يتحكم في مدى بروز الخط المتوسط على المخطط.
- طريقة التخفيف (Mitigation، الافتراضي: "Wick")
-
- ما يفعله: يحدد كيف يتم إبطال كتل الأوامر:
-
- Wick: يستخدم أدنى سعر (كتلة أوامر صاعدة) أو أعلى سعر (كتلة أوامر هابطة) للتحقق من التخفيف.
- Close: يستخدم سعر الإغلاق للتحقق من التخفيف.
- لماذا هو مهم: يؤثر على مدى حساسية المؤشر لاختراق السعر لمناطق كتل الأوامر، مما يؤثر على توقيت إزالة الكتل.
كاشف كتل الأوامر هو أداة قوية لاكتشاف مناطق الأوامر المؤسسية بناءً على ارتفاعات الحجم وحركة السعر. يرسم مستطيلات واضحة لكتل الأوامر مع خطوط متوسطة ويزيل الكتل الملغاة ديناميكيًا. يمكن للمتداولين تعديل المعلمات لضبط الكشف والعرض وإدارة كتل الأوامر لتتناسب مع أسلوب تداولهم.
الملخص
ملخص الذكاء الاصطناعي
Order Block Finder is an indicator designed to identify and display Order Blocks (OBs) on price charts. Order Blocks represent key price zones where institutional traders place significant buy or sell orders, often causing notable price reactions. This tool helps traders locate potential support and resistance areas for improved trade entries, stop-loss placements, and take-profit targets.
The indicator works by analyzing volume pivot highs and determining market state (bullish or bearish) based on highs and lows over a configurable lookback period. It marks OBs with rectangles and average lines, dynamically removing those invalidated when price breaks through the zones. Users can customize parameters such as the lookback length, the number of bullish and bearish OBs tracked, colors and styles of OB rectangles and average lines, and the method used to detect OB mitigation (using wick or close prices).
This flexibility allows traders to tailor the detection and visualization of Order Blocks to their trading style, aiding in identifying high-probability zones for trade setups, risk management, and profit targeting.
ملف تعريف المؤشر
تقييمات العملاء
5.0
التقييمات: 2
5 | 100 % | |
4 | 0 % | |
3 | 0 % | |
2 | 0 % | |
1 | 0 % |
تقييمات العملاء
December 18, 2025
THIS IS BY FAR THE BEST TOOL for OB's - as a beginner I can visually see where I am and Where I need to go - THANK YOU SO MUCH
August 12, 2025
Pros: Automatically identifies bullish and bearish order blocks based on swing breakouts with clear zones. Useful for visual SMC analysis. Cons: No alerts or tooltips. Lacks template saving and volume confirmation features. Slight delay under heavy chart load.
مناقشة
الأسئلة الشائعة
يتم توفير المنتجات المتاحة من خلال cTrader Store، بما في ذلك روبوتات التداول والمؤشرات والإضافات، من قبل مطوري الطرف الثالث وإتاحتها لأغراض الوصول المعلوماتي والفني فقط. cTrader Store ليس وسيطًا ولا يقدم نصائح استثمارية أو توصيات شخصية أو أي ضمان للأداء المستقبلي.
المزيد من هذا المؤلف


السعر
86.67M
حجم التداول
1.99M
الربح بالبيب
3.67K
التثبيتات المجانية