Descripción
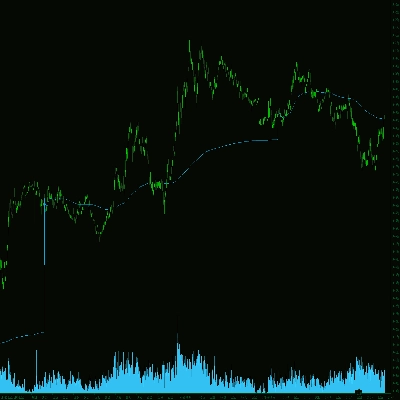
Este Indicador de Gráfico de Sentimientos por Barra es una herramienta de análisis técnico que mide la fuerza y dirección del sentimiento del mercado en base a cada barra (o vela) individual. Examina la relación entre los precios de apertura, máximo, mínimo y cierre de cada barra para determinar si el mercado mostró un comportamiento alcista, bajista o neutral durante ese período de tiempo.
Típicamente, un sentimiento alcista se identifica cuando el precio de cierre termina significativamente más alto que la apertura, indicando una fuerte presión de compra. Un sentimiento bajista se detecta cuando el cierre es notablemente más bajo que la apertura, señalando una fuerte presión de venta. Las barras neutrales, a menudo llamadas "dojis", reflejan indecisión o equilibrio entre compradores y vendedores.
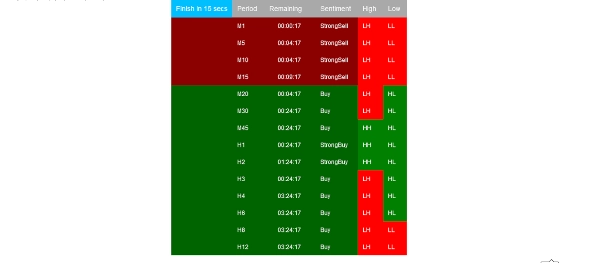
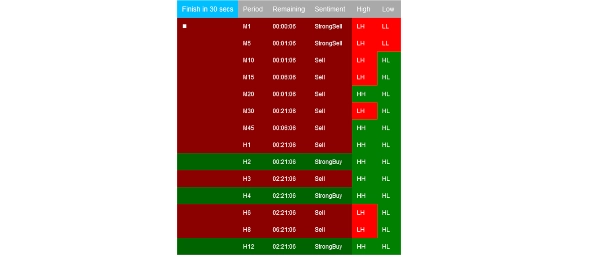
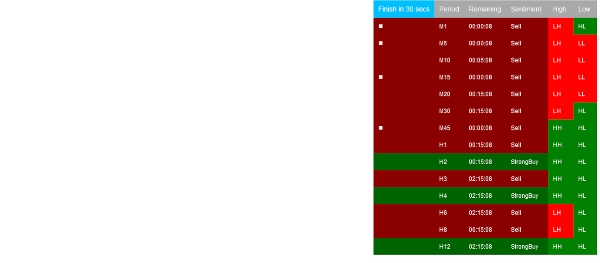
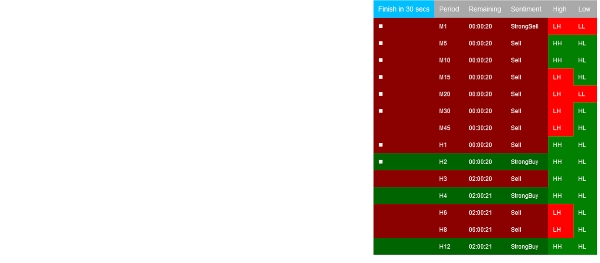
Versiones avanzadas del Indicador de Sentimientos por Barra pueden incorporar elementos adicionales como volumen, tamaño relativo del cuerpo o momentum para refinar la clasificación del sentimiento. Los sentimientos a menudo se visualizan mediante codificación de colores—verde para alcista, rojo para bajista y gris o azul para neutral—facilitando la evaluación rápida del tono predominante del mercado.
Si los 1s y 0s son los bloques fundamentales de la ingeniería de software, entonces la salida del Indicador de Gráfico de Sentimientos por Barra representa los bloques fundamentales de los sistemas avanzados de trading con aprendizaje automático. Al cuantificar el sentimiento bruto del mercado, proporciona entradas esenciales para algoritmos que buscan aprender y predecir movimientos futuros de precios basados en comportamientos históricos.
Usando el Indicador de Gráfico de Sentimientos por Barra, los traders obtienen una comprensión más profunda de la dinámica micro del mercado, ayudándoles a identificar la fuerza de la tendencia, posibles reversals y períodos de consolidación—especialmente cuando se combina con análisis multitemporal y otras herramientas técnicas.
Resumen
Advanced versions may integrate factors like volume, relative body size, or momentum to enhance sentiment accuracy. The indicator typically uses color-coding—green for bullish, red for bearish, and gray or blue for neutral—to visually represent market tone. By quantifying raw market sentiment, it provides foundational data useful for machine learning trading systems aiming to predict future price movements.
Traders can use this indicator to gain insight into micro market dynamics, helping to identify trend strength, potential reversals, and consolidation phases. It is particularly effective when combined with multi-timeframe analysis and other technical tools.
Valoraciones de clientes
5 | 100 % | |
4 | 0 % | |
3 | 0 % | |
2 | 0 % | |
1 | 0 % |


![Logotipo de "[Stellar Strategies] Smart ADX"](https://cdn.ctrader.com/image/webp/af13b084-b6f6-41db-b7bc-c7e688b57b05_36929)