
Auto Support and Resistance Trend Lines
مؤشر
الإصدار 1.0، Feb 2025
Windows, Mac
منذ 03/10/2024
177
المبيعات
45.37K
التثبيتات المجانية
الوصف
الملخص
ملخص الذكاء الاصطناعي
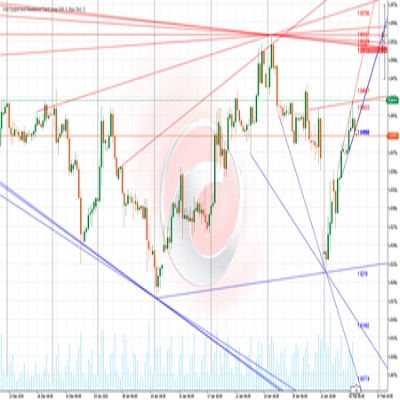
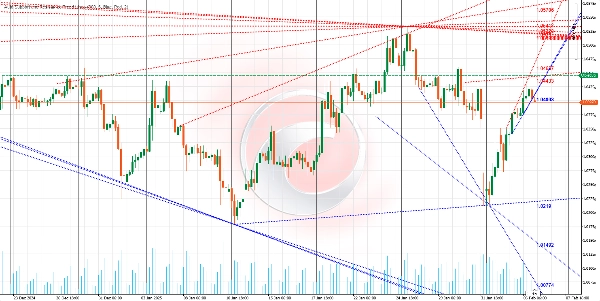
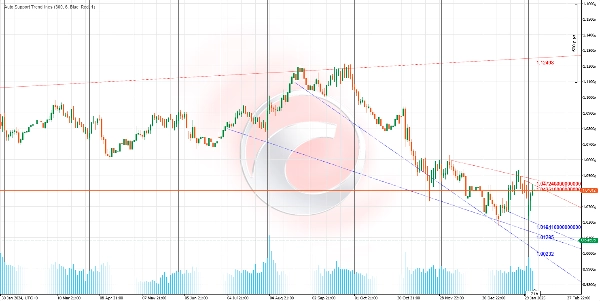
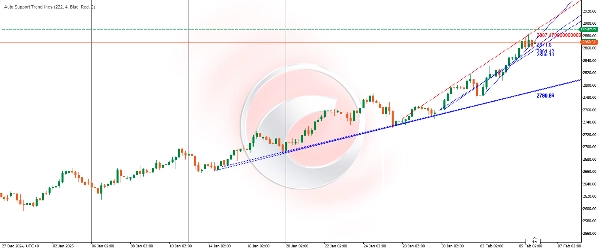
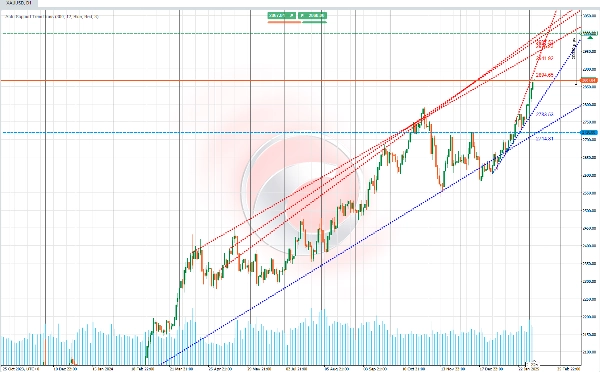
Auto Support and Resistance Trend Lines is an indicator that automatically identifies and draws key support and resistance levels on price charts. It detects both horizontal lines and diagonal channels that represent market trends, highlighting areas where price has historically struggled to move higher (resistance) or lower (support).
The algorithm analyzes price history by identifying local lows and highs within a specified range of bars. It validates these levels by checking if the price has respected them multiple times in the past. Validated support and resistance levels are drawn as horizontal or diagonal lines. Additionally, the indicator connects these levels to form diagonal channels that indicate bullish or bearish trends.
The indicator updates dynamically with each new bar, recalculating and redrawing levels based on the latest price action. Traders can customize parameters such as the number of bars analyzed, line thickness, and colors to suit different trading styles and visual preferences.
This tool aids traders by providing a macro view of market trends, identifying critical support and resistance zones useful for setting entry and exit points, stop-loss and take-profit orders, and spotting potential breakouts or reversals. It automates technical analysis, saving time and helping traders make more informed decisions.
The algorithm analyzes price history by identifying local lows and highs within a specified range of bars. It validates these levels by checking if the price has respected them multiple times in the past. Validated support and resistance levels are drawn as horizontal or diagonal lines. Additionally, the indicator connects these levels to form diagonal channels that indicate bullish or bearish trends.
The indicator updates dynamically with each new bar, recalculating and redrawing levels based on the latest price action. Traders can customize parameters such as the number of bars analyzed, line thickness, and colors to suit different trading styles and visual preferences.
This tool aids traders by providing a macro view of market trends, identifying critical support and resistance zones useful for setting entry and exit points, stop-loss and take-profit orders, and spotting potential breakouts or reversals. It automates technical analysis, saving time and helping traders make more informed decisions.
ملف تعريف المؤشر
مناقشة
تقييمات العملاء
0.0
التقييمات: 0
تقييمات العملاء
لا توجد تقييمات لهذا المنتج حتى الآن. هل جرَّبته بالفعل؟ كن أول من يخبر الآخرين!
الأسئلة الشائعة
Supertrend
RSI
يتم توفير المنتجات المتاحة من خلال cTrader Store، بما في ذلك روبوتات التداول والمؤشرات والإضافات، من قبل مطوري الطرف الثالث وإتاحتها لأغراض الوصول المعلوماتي والفني فقط. cTrader Store ليس وسيطًا ولا يقدم نصائح استثمارية أو توصيات شخصية أو أي ضمان للأداء المستقبلي.






























السعر
منذ 03/10/2024
177
المبيعات
45.37K
التثبيتات المجانية