
Deskripsi
Indikator ini mengidentifikasi zona likuiditas dan blok order di pasar, mengikuti konsep dari Smart Money Market Theory (ICT/SMC).
https://ctrader.com/pt/products/1560
https://ctrader.com/pt/products/1386
Indikator ini beroperasi dalam empat langkah utama:
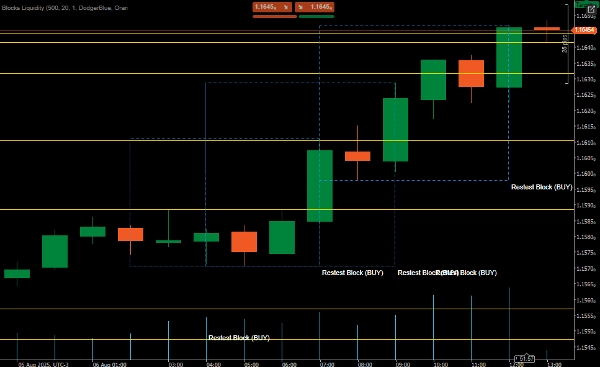
✅Identifikasi Blok Order
Mendeteksi pergerakan impulsif (minimal 20 pips secara default)
Menemukan zona konsolidasi sebelum impuls
Mengklasifikasikan sebagai blok beli atau jual
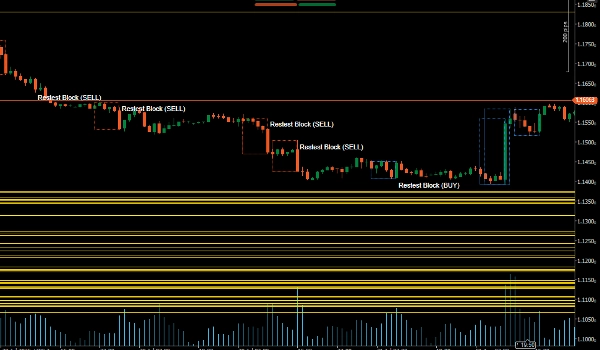
✅Identifikasi Kolam Likuiditas
Menandai titik tertinggi dan terendah terbaru sebagai zona likuiditas
Area ini mewakili target potensial atau titik berhenti
✅Konfirmasi Retest
Memeriksa saat harga kembali ke blok order
Mengonfirmasi dengan pola pembalikan (Pin Bar/Engulfing) dan volume
✅Visualisasi Grafik
Menggambar blok order dan zona likuiditas
Mengeluarkan peringatan suara saat konfirmasi
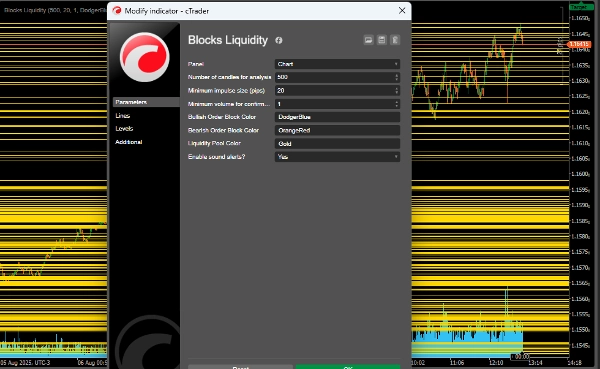
✅Parameter yang Dapat Dikustomisasi
LookbackPeriod: Jumlah candle yang dianalisis (500 secara default)
MinImpulsePips: Ukuran minimum pergerakan impulsif (20 pips)
MinVolumeThreshold: Volume minimum untuk konfirmasi (1.0)
Warna yang dapat disesuaikan untuk blok bullish/bearish dan zona likuiditas
Opsi peringatan suara
✅Logika Trading
Blok bullish (beli):
Terbentuk setelah konsolidasi dan momentum naik
Zona dukungan potensial
Entri dikonfirmasi oleh pola pembalikan + volume pada retest
Blok bearish (jual):
Terbentuk setelah konsolidasi dan momentum turun
Zona resistensi potensial
Entri dikonfirmasi dengan cara yang sama
✅Kolam Likuiditas:
Tertinggi/terendah terbaru sebagai target atau titik berhenti
Area di mana kemungkinan terdapat konsentrasi order stop
Ringkasan
Key features include:
- Order Block Identification: Detects bullish and bearish blocks formed after consolidation and momentum shifts, serving as potential support or resistance zones.
- Liquidity Pool Identification: Highlights recent highs and lows that may act as targets or stop areas due to stop order concentration.
- Retest Confirmation: Validates entries by checking price returns to order blocks combined with reversal candlestick patterns (Pin Bar, Engulfing) and volume thresholds.
- Chart Visualization: Draws order blocks and liquidity zones with customizable colors and provides sound alerts upon confirmation.
- Configurable parameters such as lookback period, minimum impulse size, and volume threshold allow adaptation to different trading preferences.
This indicator supports analysis of price action dynamics to assist traders in identifying key market levels and potential trade entry points.
Ulasan pelanggan
5 | 100 % | |
4 | 0 % | |
3 | 0 % | |
2 | 0 % | |
1 | 0 % |


![Logo "[Hamster-Coder] Pivot Points MTF"](https://cdn.ctrader.com/image/webp/4c143e5a-309c-40e3-a578-f04d1e133ffa_31159)


