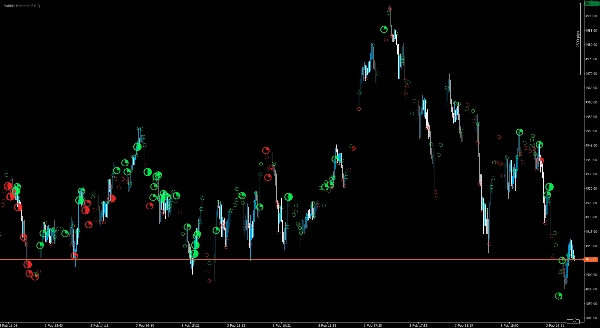
Bubble Indicator 2.0
مؤشر
3 عمليات الشراء
Version 1.0, Feb 2026
Windows, Mac
صورة "Bubble Indicator 2.0" المحملة
منذ 10/01/2026
3
المبيعات
نبذة عن الإصدار التجريبي
- Test it 2 Days

Delta Peak Bubbles is built for traders who want a fast, visual way to identify “where the market is doing the work” on tick charts. Instead of cluttering your screen with extra panels, it draws clear, graded bubbles directly on the chart to reveal high‑intensity bursts of activity in real time.

The indicator focuses on peak moments within each bar and visualizes them with an easy‑to-read strength scale (from subtle circles up to a standout star for the strongest events). Bubbles are color‑coded for quick directional context, making it simple to distinguish bullish vs. bearish pressure at a glance.

Designed for practical trading workflows, Delta Peak Bubbles works especially well for:

  • Scalping and short‑term momentum trading
  • Breakout confirmation and impulse tracking
  • Identifying reaction zones and potential exhaustion points
  • Adding a “heat layer” to Price Action / SMC / key level strategies

Bubble strength guide

Bubbles are graded into four strength levels to help you quickly separate normal activity from high‑impact spikes:

  • Level 1 – Low:  (minor spike)
  • Level 2 – Medium:  (moderate spike)
  • Level 3 – High:  (strong spike)
  • Level 4 – Extreme:  (very strong / standout spike)

Color indicates directional pressure (green = bullish, red = bearish).

Display controls make it clean on any layout, including 4K monitors, so you can keep your chart readable while still seeing the important moments.

Disclaimer: Trading/Investing involves substantial risk and may result in the loss of all invested capital. This indicator is provided for informational and analytical purposes only and does not constitute financial advice, an offer, or a recommendation. Use is at your own risk; you remain solely responsible for all trading decisions and outcomes. The provider makes no representations or warranties (express or implied) regarding accuracy, completeness, timeliness, performance, merchantability, or fitness for a particular purpose. To the fullest extent permitted by law, the provider shall not be liable for any direct or indirect losses, damages, or lost profits arising from or related to the use of this indicator (including, without limitation, losses due to market conditions, data/platform issues, configuration errors, or misuse). Past performance is not a reliable indicator of future results.

0.0
التقييمات: 0
تقييمات العملاء
لا توجد تقييمات لهذا المنتج حتى الآن. هل جرَّبته بالفعل؟ كن أول من يخبر الآخرين!
Breakout
SMC
Scalping

قد يعجبك أيضًا

مؤشر
NAS100
NZDUSD
XAUUSD
+11
Volume Profile Pro
Visualize trading volume by price within any range, highlight POC and key value areas.
مؤشر
Grid
NAS100
NZDUSD
+17
SmartFractalZigZagPro
Smart fractal + ZigZag with fully automated Fibonacci levels for precise swing and structure trading.
مؤشر
NAS100
NZDUSD
XAUUSD
+15
SuperTrend from TradingView
Get the exact SuperTrend experience from TV, now perfectly rebuilt for cTrader
مؤشر
NAS100
NZDUSD
Forex
+23
DailyMA
Daily moving averages, simplified. Displays 3 daily moving averages on lower timeframes with selectable MA types.
مؤشر
Indices
Commodities
Stocks
+2
MARainbow
MARainbow gives you the edge with four customizable moving averages—each color-coded for instant recognition.
مؤشر
Indices
RSI
XAUUSD
+5
cAlgoBuddy - Composite Index RSI
What Constance Brown did with the RSI was to input a momentum calculation within the RSI itself. This the Composite RSI.
مؤشر
NAS100
NZDUSD
XAUUSD
+11
Session HighLow Pivot Points Indicator advanced version
Visualize global trading sessions with colored range boxes. Track New York, London, Tokyo, and Sydney sessions
الأعلى تقييمًا
مجاني
EKVWAP
This is an advanced VWAP indicator (Anchored or non-Anchored) that allows you to customize all the aspects of it.
مؤشر
Breakout
Stocks
Signal
Darvas Box
The Darvas Box involves identifying "boxes" or trading ranges where a stock's price consolidates before breaking out.
Momentum Trend Analyzer
Provides comprehensive trend and momentum analysis by combining EMAs, RoC, normalized ATR, RSI, and volume..
مؤشر
Grid
RSI
XAUUSD
+12
PFO Price Flow Oscillator
technical analysis tool designed to provide traders with a structured view of market momentum and volatility
مؤشر
NAS100
NZDUSD
XAUUSD
+11
Consolidation Zones
Identify and trade breakouts with Consolidation Zones! Visualize price consolidation areas for trading opportunities.
منذ 10/01/2026
3
المبيعات