الوصف
كاشف التحيز للإطار الزمني الأعلى — إصدار اللوحة
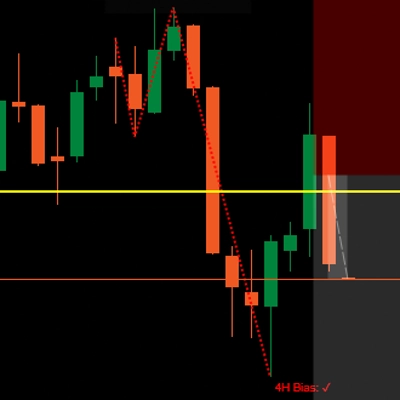
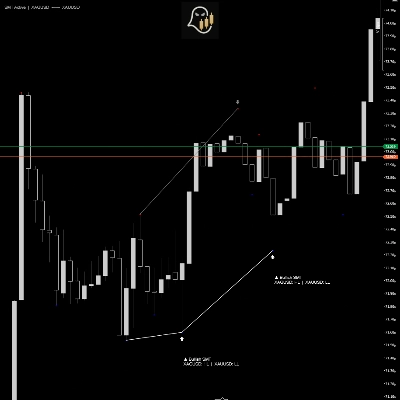
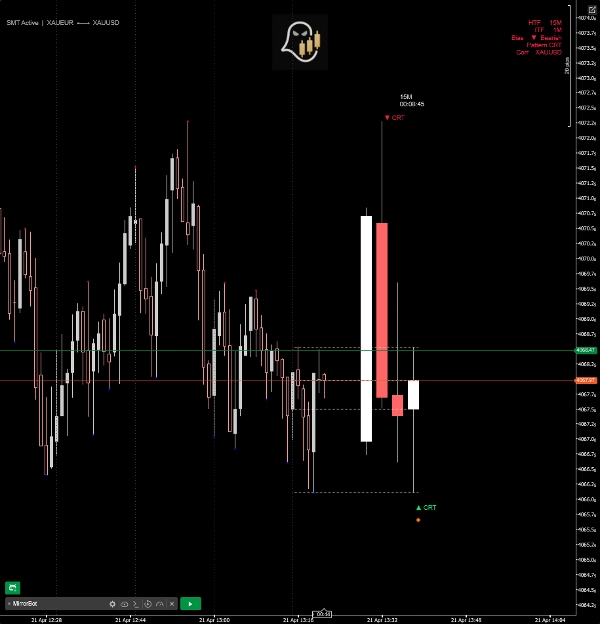
اطلع على قصة الإطار الزمني الأعلى بنظرة سريعة. يعرض كاشف التحيز للإطار الزمني الأعلى آخر N شمعة من الإطار الزمني الأعلى في لوحة عائمة مباشرة على الرسم البياني الخاص بك — لا حاجة لتغيير الأطر الزمنية — ويحدد تلقائيًا التحيز السائد باستخدام أربعة أنماط حركة سعر مؤسسية.
كيف يعمل
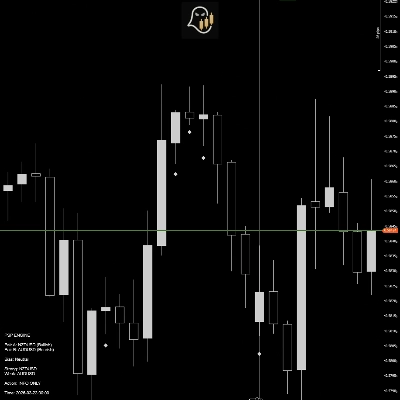
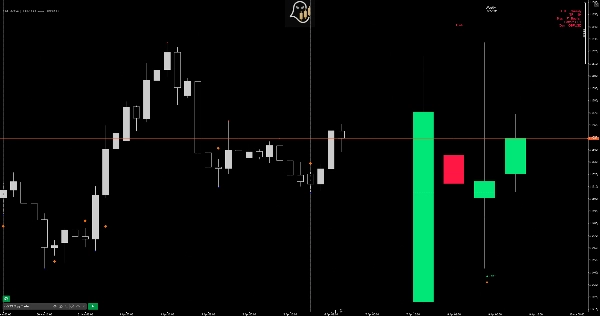
يقوم المؤشر بربط إطارك الزمني الحالي على الرسم البياني بالإطار الزمني الأعلى الطبيعي له (مثلاً 5 دقائق → 1 ساعة، 1 ساعة → يومي) ويرسم تلك الشموع للإطار الزمني الأعلى في لوحة نظيفة مثبتة إلى يمين السعر. ثم يتم تشغيل كشف الأنماط على تلك الشموع في الوقت الحقيقي.
الأنماط المكتشفة
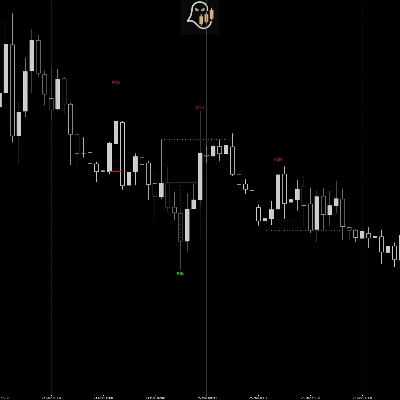
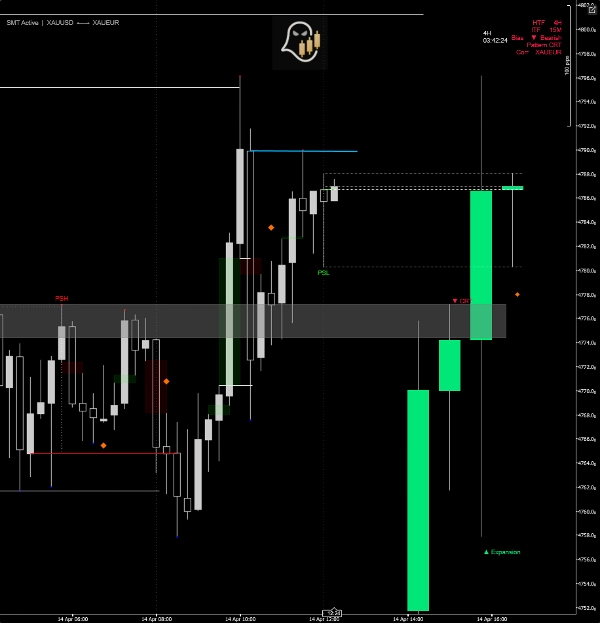
- CRT (نظرية نطاق الشمعة) — يحدد شموع الفخ التي تمسح قمة أو قاع سابق وتغلق داخلها مجددًا، مما يشير إلى احتمال حدوث انعكاس.
- التوسع — يميز الشموع التي تبتلع النطاق السابق بالكامل وتغلق خارجه، مؤكدة الزخم الاتجاهي.
- نقطة التأرجح — يكتشف تسلسلات من ثلاث شموع حيث تتبع شمعة الإزاحة انعكاس قوي، مما يشير إلى نقطة تحول هيكلية.
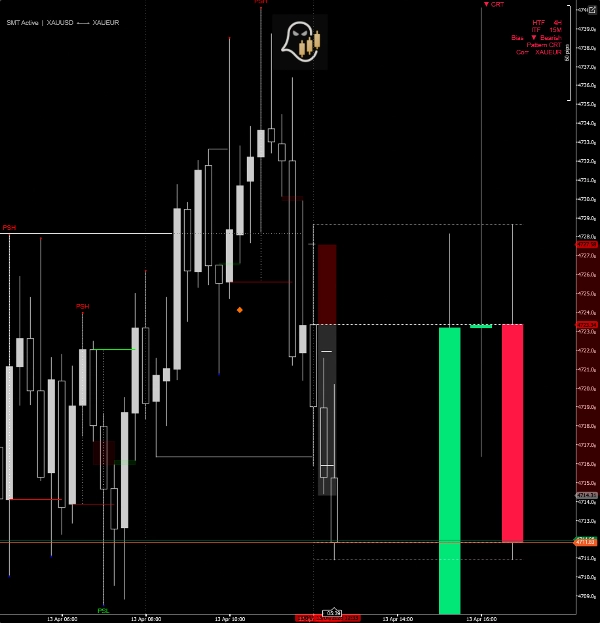
- PSP (نقطة التأرجح الدقيقة) — إشارة تباعد عبر الأزواج. عندما يطبع الرمز الأساسي وزوجه المرتبط شموعًا ذات اتجاهات متعاكسة في نفس شريط الإطار الزمني الأعلى، يتم رسم ماسة PSP.
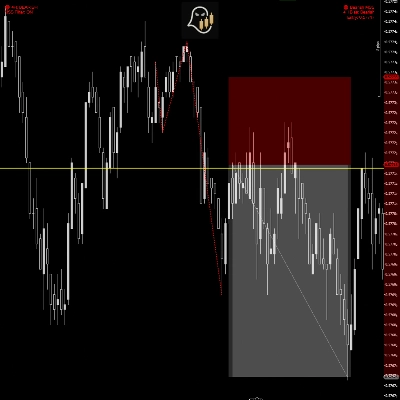
تباعد SMT (لوحة الإطار الزمني الأعلى)
يقارن أزواج الشموع المتتالية للإطار الزمني الأعلى بين الأدوات المرتبطة. عندما يصنع زوج واحد قاعًا أدنى بينما يصنع الآخر قاعًا أعلى (أو العكس بالنسبة للقمم)، يتم رسم خط تباعد SMT مباشرة على اللوحة مع تسمية اتجاهية.
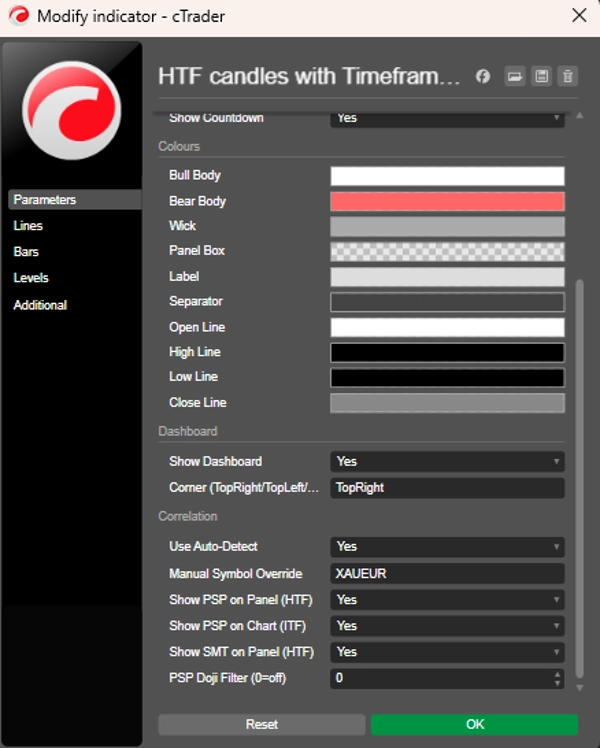
الكشف التلقائي عن الزوج المرتبط
يحدد تلقائيًا الأداة المرتبطة لرمز الرسم البياني الخاص بك — ويغطي أزواج الفوركس الرئيسية والمعادن والمؤشرات والعملات المشفرة. كما يتوفر تجاوز يدوي للأزواج المخصصة أو أسماء الرموز الخاصة بالوسطاء.
ميزات إضافية
- مؤقت عد تنازلي مباشر حتى إغلاق شمعة الإطار الزمني الأعلى التالية
- خطوط مرجعية منقطة لـ OHLC للشمعة الحالية للإطار الزمني الأعلى
- فواصل عمودية على الرسم البياني المباشر متوافقة مع أوقات فتح الإطار الزمني الأعلى
- لوحة تحكم مدمجة تعرض الإطار الزمني الأعلى، الإطار الزمني الداخلي، التحيز المكتشف، اسم النمط، والزوج المرتبط
- ماسات PSP للإطار الزمني الداخلي مرسومة مباشرة على أشرطة الرسم البياني (الإطار الزمني الحالي)
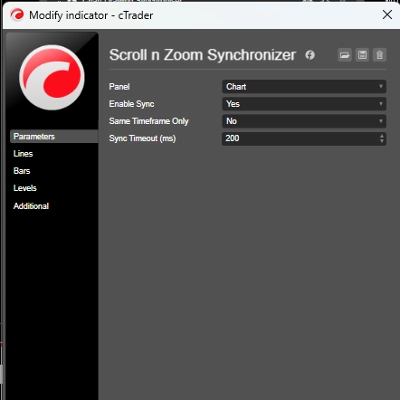
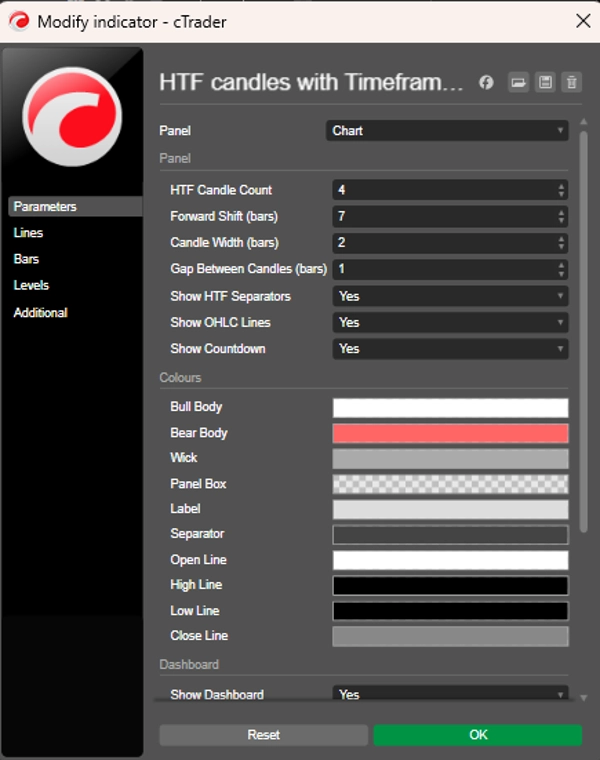
- ألوان، عرض اللوحة، عدد الشموع، والتموضع قابلة للتخصيص بالكامل
- مرشح الدوجي لقمع إشارات PSP الضعيفة
خريطة الأطر الزمنية
لوحة الإطار الزمني الأعلى لإطار الرسم البياني
1 دقيقة – 4 دقائق 15 دقيقة
5 دقائق – 10 دقائق 1 ساعة
15 دقيقة – 30 دقيقة 4 ساعات
1 ساعة يومي
4 ساعات أسبوعي
يومي شهري
الملخص
The indicator detects four institutional price action patterns in real time on these HTF candles: Candle Range Theory (CRT) trap candles signaling reversals, Expansion candles confirming momentum, Swing Point sequences marking structural turns, and Precision Swing Point (PSP) diamonds indicating cross-pair divergences. It also identifies SMT (Smart Money Technique) divergences between correlated instruments by comparing consecutive HTF candle pairs.
Correlated pairs are auto-detected for major forex pairs, metals, indices, and cryptocurrencies, with manual override options available. Additional features include a live countdown timer to the next HTF candle close, OHLC reference lines, vertical HTF open time separators, a compact dashboard showing HTF and intermediate timeframe bias and patterns, and customizable visual settings. The indicator supports multiple markets including forex, indices, and commodities.
تقييمات العملاء
5 | 50 % | |
4 | 50 % | |
3 | 0 % | |
2 | 0 % | |
1 | 0 % |