
الوصف
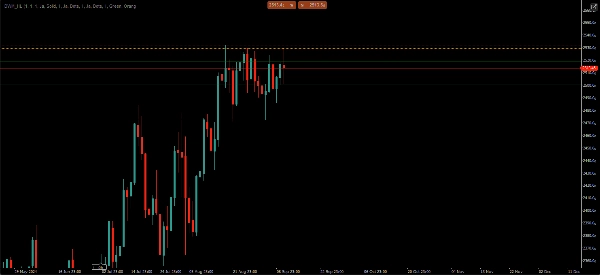
مستويات السيولة في NGS – أعلى وأدنى يومية • أسبوعية • شهرية
تداول حول السيولة، وليس حول خطوط عشوائية.
يعرض مؤشر NGS Liquidity Levels تلقائيًا أهم مستويات السيولة اليومية والأسبوعية والشهرية على كل رسم بياني.
• لا حاجة للرسم اليدوي
• لا حاجة لتغيير الإطار الزمني
• لا ازدحام في الرسم البياني
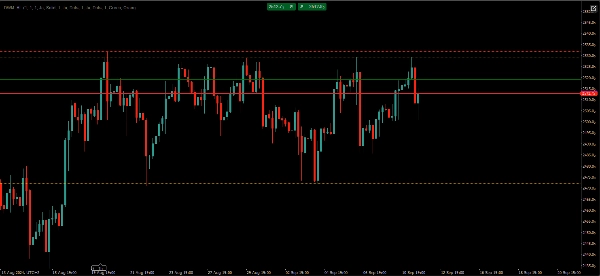
يساعد هذا المؤشر سهل الاستخدام المتداولين على تحديد مستويات السيولة وهيكل السوق الرئيسية خلال ثوانٍ. بدلاً من تحديد القمم والقيعان يدويًا كل يوم، يتم عرض أهم المستويات وتحديثها تلقائيًا من أجلك.
الميزات:
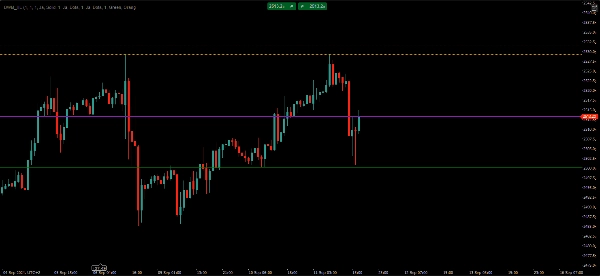
• مستويات أعلى وأدنى يومية تلقائية
• مستويات أعلى وأدنى أسبوعية تلقائية
• مستويات أعلى وأدنى شهرية تلقائية
• مستويات الفترة السابقة اختيارية
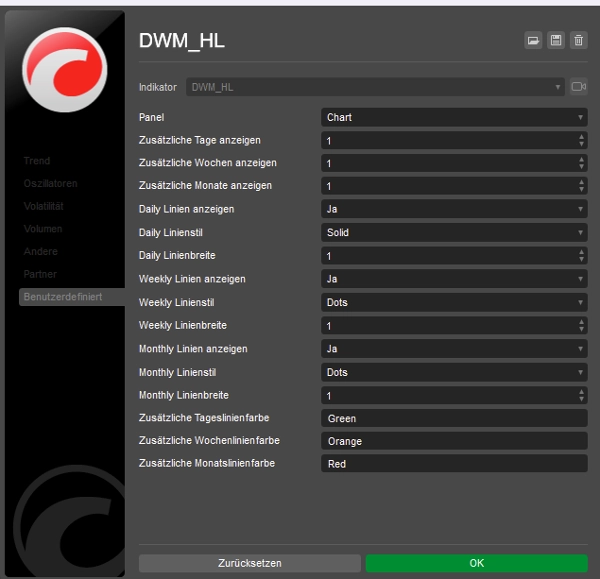
• ألوان وأنماط خطوط قابلة للتخصيص
• عرض نظيف وخفيف على الرسم البياني
• يعمل عبر الفوركس، المؤشرات، السلع والعملات الرقمية
• يدعم أطر زمنية متعددة
• لا يعيد الرسم
مصمم للمتداولين الذين يركزون على هيكل السوق، السيولة ومستويات الأطر الزمنية الأعلى.
لا إشارات.
لا استراتيجية.
لا وعود بالربح.
مجرد مستويات سيولة موضوعية وسير عمل تداول أنظف.
الملخص
تقييمات العملاء
5 | 100 % | |
4 | 0 % | |
3 | 0 % | |
2 | 0 % | |
1 | 0 % |


