
Footprint Chart_noSourceCode
مؤشر
1 عمليات الشراء
الإصدار 1.0، Sep 2025
Windows, Mac
4.3
التقييمات: 3
الوصف
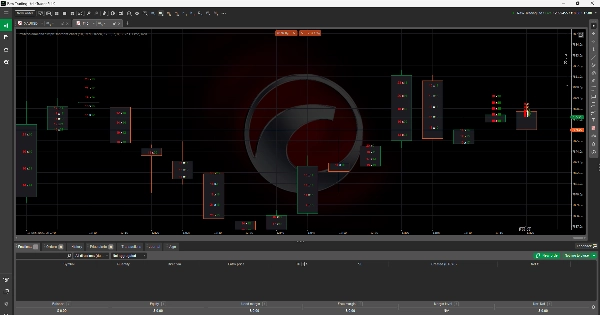
مؤشر مخطط البصمة
يوفر مؤشر مخطط البصمة للمتداولين عرضًا تفصيليًا لتدفق الأوامر من خلال عرض حجم العرض والطلب مباشرة داخل كل شمعة سعر. على عكس مخططات الشموع التقليدية، يتيح هذا الأداة للمستخدمين رؤية مكان تركيز ضغط الشراء والبيع عند مستويات سعرية محددة. من خلال تسليط الضوء على الاختلالات بين المشترين والبائعين، يقدم رؤى أعمق في عمق السوق والسيولة ونشاط التداول. هذا يجعله أداة أساسية للمتداولين الذين يسعون لتحسين نقاط الدخول والخروج وإدارة المخاطر من خلال تحليل متقدم لتدفق الأوامر.
الملخص
ملخص الذكاء الاصطناعي
The Footprint Chart Indicator enhances traditional candlestick charts by displaying bid and ask volumes within each price candle. This visualization allows traders to observe buying and selling pressure at specific price levels, revealing imbalances between buyers and sellers. By providing detailed insights into order flow, market depth, liquidity, and trading activity, the indicator supports more precise trade entries, exits, and risk management decisions. It is applicable across various markets including Forex, cryptocurrencies (e.g., BTCUSD), commodities, indices, and stocks. The tool is designed for traders who utilize advanced order flow analysis to refine their strategies.
ملف تعريف المؤشر
تقييمات العملاء
4.3
التقييمات: 3
5 | 67 % | |
4 | 0 % | |
3 | 33 % | |
2 | 0 % | |
1 | 0 % |
تقييمات العملاء
September 29, 2025
This fits volume based context better as a review layer. The first forward check can be 97 setups on M1, with 20 reactions and manual notes.
September 26, 2025
More useful for someone who wants less noise in the process. The best use is checking participation and pressure, then leaving the final filter manual.
September 23, 2025
I liked it more as a confirmation layer for volume based context than as something to follow blindly. Pressure is easier to read, and the final decision still feels like it belongs to the trader. Light sizing makes the early sample easier to judge.
مناقشة
الأسئلة الشائعة
BTCUSD
Forex
Signal
Indices
EURUSD
Commodities
GBPUSD
NZDUSD
Prop
Scalping
Crypto
Stocks
XAUUSD
NAS100
USDJPY
يتم توفير المنتجات المتاحة من خلال cTrader Store، بما في ذلك روبوتات التداول والمؤشرات والإضافات، من قبل مطوري الطرف الثالث وإتاحتها لأغراض الوصول المعلوماتي والفني فقط. cTrader Store ليس وسيطًا ولا يقدم نصائح استثمارية أو توصيات شخصية أو أي ضمان للأداء المستقبلي.
المزيد من هذا المؤلف


السعر
منذ 15/01/2025
7
المبيعات