
WVAP-Bands Indicator_noSourceCode
مؤشر
1 عمليات الشراء
الإصدار 1.0، Sep 2025
Windows, Mac
4.5
التقييمات: 2
الوصف
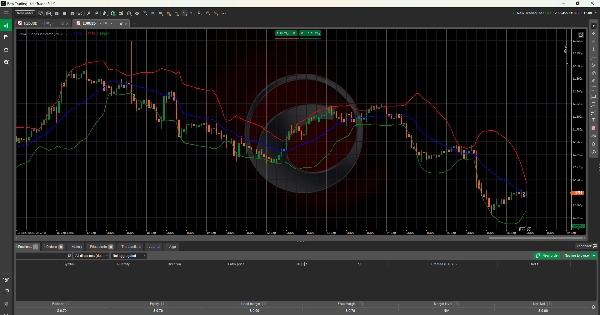
أشرطة VWAP - تحليل حجم احترافي
حوّل تداولك بدقة على مستوى المؤسسات
يقدم مؤشر أشرطة VWAP تحليل سعر مرجح بالحجم احترافي مع أشرطة انحراف معياري ديناميكية. يستخدمه المتداولون المؤسسيون حول العالم لتحديد نقاط الدخول والخروج المثلى.
🚀 الميزات الرئيسية
- حساب VWAP الحقيقي: متوسط السعر المرجح بالحجم باستخدام منهجية HLC/3
- أشرطة ديناميكية: أشرطة علوية/سفلية تعتمد على الانحراف المعياري المرجح بالحجم
- تخصيص كامل: فترات قابلة للتعديل، ألوان، وعوامل عرض الأشرطة
- تحليل في الوقت الحقيقي: يتحدث مع كل شريط للحصول على رؤية فورية للسوق
📊 تطبيقات التداول
- تشبع الشراء/البيع: الشريط العلوي = إشارات بيع، الشريط السفلي = إشارات شراء
- دعم/مقاومة ديناميكية: يعمل VWAP كمستوى مرجعي مؤسسي
- الارتداد إلى المتوسط: تداول الانعكاسات عندما يمتد السعر إلى أقصى الأشرطة
- تأكيد الاتجاه: اختراقات قوية عبر الأشرطة تشير إلى الاستمرار
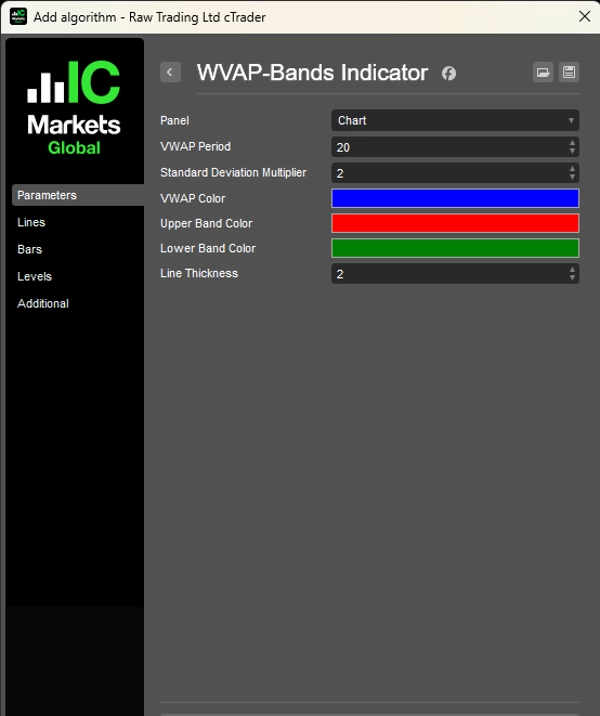
⚙️ الإعدادات الاحترافية
- فترة VWAP: 1-200 شريط (الافتراضي: 20)
- الانحراف المعياري: مضاعف 0.1-5.0 (الافتراضي: 2.0)
- تخصيص بصري: ألوان مخصصة وسماكة الخط
- متعدد الأطر الزمنية: يعمل على جميع الأطر الزمنية والأدوات
✅ لماذا أشرطة VWAP؟
أفضل من المتوسطات المتحركة البسيطة، توفر أشرطة VWAP:
- دقة مرجحة بالحجم لتحليل مؤسسي حقيقي
- أشرطة تقلب متكيفة تتكيف مع ظروف السوق
- منهجية احترافية يستخدمها المتداولون الناجحون عالميًا
- تطبيق عالمي عبر الفوركس، الأسهم، العملات الرقمية، والسلع
مثالي للمتداولين السريعين، ومتداولي اليوم، ومتداولي التأرجح الباحثين عن تحليل حجم احترافي.
متوافق مع cTrader 4.0+. يعمل على جميع الأدوات والأطر الزمنية.
الملخص
ملخص الذكاء الاصطناعي
The WVAP-Bands Indicator provides volume-weighted average price (VWAP) analysis enhanced with dynamic standard deviation bands. It calculates VWAP using the HLC/3 price method and overlays upper and lower bands based on volume-weighted standard deviation, offering adaptive volatility measures. The indicator supports full customization of periods, colors, and band width multipliers, allowing traders to tailor it to their strategies. It updates in real time with each new bar, delivering immediate market insights.
Key trading applications include identifying overbought and oversold conditions (upper band signals sell, lower band signals buy), dynamic support and resistance levels with VWAP as an institutional reference, mean reversion opportunities when prices reach band extremes, and trend confirmation through breakouts beyond the bands. Settings allow adjustment of VWAP period (1–200 bars), standard deviation multiplier (0.1–5.0), and visual elements such as colors and line thickness.
The indicator is compatible with all timeframes and instruments, including forex, stocks, cryptocurrencies, commodities, and indices. It is designed for scalpers, day traders, and swing traders seeking professional-grade volume analysis and is compatible with cTrader 4.0 and above.
ملف تعريف المؤشر
تقييمات العملاء
4.5
التقييمات: 2
5 | 50 % | |
4 | 50 % | |
3 | 0 % | |
2 | 0 % | |
1 | 0 % |
تقييمات العملاء
October 4, 2025
The sample size matters. The useful metric is POC and VWAP first, compare the result with 20 reactions, and only scale if 2 sessions still looks controlled.
October 3, 2025
I liked it more as a extra filter for volume based context than as something to follow blindly. Pressure is easier to read, and the final decision still feels like it belongs to the trader. The next review on it on value area.
مناقشة
الأسئلة الشائعة
BTCUSD
Forex
Signal
Breakout
Indices
EURUSD
Commodities
GBPUSD
NZDUSD
Prop
Scalping
Crypto
Stocks
XAUUSD
NAS100
USDJPY
VWAP
يتم توفير المنتجات المتاحة من خلال cTrader Store، بما في ذلك روبوتات التداول والمؤشرات والإضافات، من قبل مطوري الطرف الثالث وإتاحتها لأغراض الوصول المعلوماتي والفني فقط. cTrader Store ليس وسيطًا ولا يقدم نصائح استثمارية أو توصيات شخصية أو أي ضمان للأداء المستقبلي.
المزيد من هذا المؤلف


![شعار "Wyckoff Toolkit [Iridio Capital]"](https://cdn.ctrader.com/image/webp/8acfe6a1-6a8e-4578-9367-9df3af2b1801_27763)


![شعار "[Stellar Strategies] Smart ADX"](https://cdn.ctrader.com/image/webp/af13b084-b6f6-41db-b7bc-c7e688b57b05_36929)

السعر
منذ 15/01/2025
7
المبيعات