
الوصف
ملف حجم الجلسة عالي الدقة
ما الذي يفعله
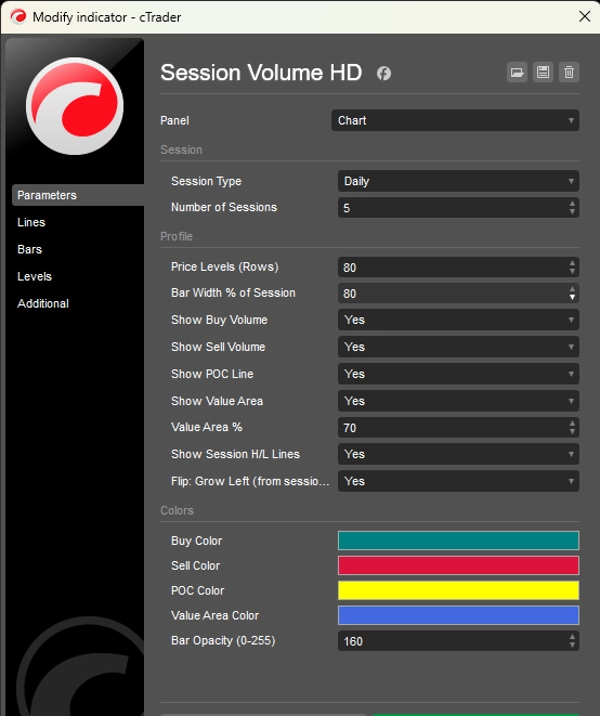
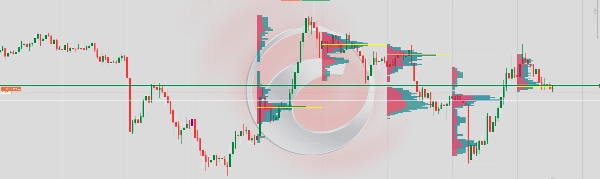
يعرض ملف حجم أفقي لكل جلسة تداول مباشرة على الرسم البياني. يُظهر كيف يتم توزيع حجم التداول عبر مستويات السعر، مما يساعد المتداولين على تحديد مناطق النشاط العالي، مناطق القيمة العادلة، ومستويات الدعم/المقاومة الرئيسية المستمدة فقط من سلوك الحجم.
كيف يعمل
عند إغلاق كل شريط جديد، يقوم المؤشر بمسح جميع الأشرطة ضمن عدد الجلسات المحدد ويوزع حجم التكت لكل شريط عبر نطاق سعره. يتم تقسيم الحجم إلى جانب الشراء (الأشرطة الصاعدة) وجانب البيع (الأشرطة الهابطة) باستخدام اتجاه فتح/إغلاق الشريط كبديل. يتم عرض النتيجة كمدرج تكراري أفقي متعدد الطبقات مرتبط بحدود وقت الجلسة.
العناصر المرئية
أشرطة الشراء (أزرق مخضر) — تعرض حجم التداول على حركة السعر الصاعدة عند كل مستوى. تنمو نحو اليسار (أو اليمين إذا تم قلبها) من مرساة الجلسة.
أشرطة البيع (أحمر) — تعرض حجم التداول على حركة السعر الهابطة عند كل مستوى، مكدسة بجانب أشرطة الشراء.
خط نقطة التحكم (أصفر) — نقطة التحكم. خط أفقي يحدد مستوى السعر الذي يحتوي على أعلى حجم إجمالي في الجلسة. يعمل كمغناطيس للسعر.
منطقة القيمة (تراكب أزرق) — نطاق السعر الذي يحتوي على نسبة مئوية قابلة للتكوين (الافتراضي 70%) من إجمالي حجم الجلسة. تمثل منطقة "القيمة العادلة" حيث حدث معظم التداول.
خطوط أعلى/أدنى الجلسة (نقطية بيضاء) — تحدد أعلى وأدنى سعر تم الوصول إليه خلال الجلسة.
الأداء
يعيد المؤشر الرسم مرة واحدة فقط لكل شريط جديد، وليس عند كل تكت. هذا يلغي الوميض ويضمن عرضًا مستقرًا حتى مع وجود العديد من الجلسات وعدد كبير من مستويات السعر.
القيود
نظرًا لأن cTrader لا يكشف عن حجم العرض/الطلب الحقيقي على مستوى الشريط بدون تغذية بيانات التكت، فإن حجم الشراء/البيع يتم تقريبه باستخدام اتجاه الشريط: الأشرطة الصاعدة تُوزن بنسبة 65% شراء / 35% بيع، والأشرطة الهابطة بالعكس، وأشرطة الدوجي تُقسم 50/50. للحصول على حجم دلتا حقيقي، ستكون هناك حاجة لاشتراك في بيانات التكت.


