
SwingHighLow
مؤشر
10 عمليات الشراء
الإصدار 1.0، Jul 2025
Windows, Mac
4.3
التقييمات: 3
الوصف
مؤشر القمم والقيعان المتأرجحة لـ cTrader
ارسم هيكل السوق كمحترف.
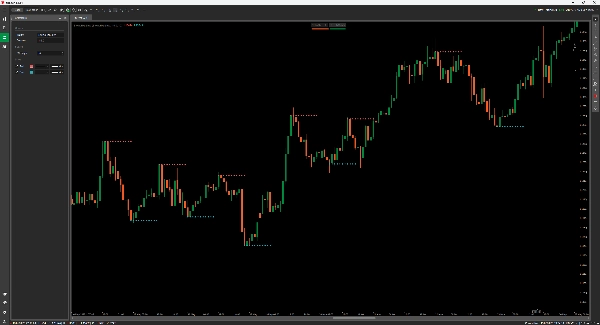
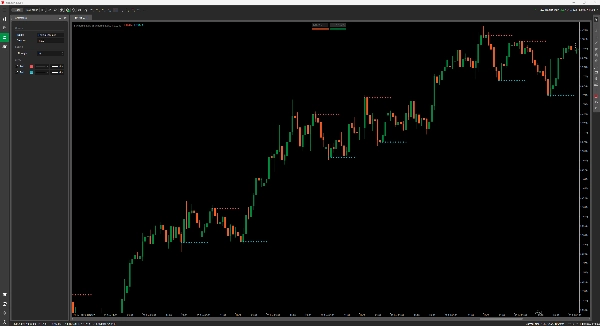
يقوم هذا المؤشر للقمة/القاع المتأرجح بالكشف التلقائي ورسم نقاط التحول المهمة على الرسم البياني الخاص بك—مثالي للمتداولين الذين يعتمدون على حركة السعر، الهيكل، ومناطق الدعم/المقاومة.
الميزات:
- يبرز القمم المتأرجحة المؤكدة (باللون الأحمر) و القيعان المتأرجحة (باللون الأزرق) مع نقاط رسم واضحة.
- معامل القوة القابل للتعديل يتيح لك تصفية الضوضاء أو تضييق الإشارات.
- مثالي لتحليل الاتجاه، اكتشاف الانعكاسات، وفخاخ الاختراق.
يعمل على جميع الأطر الزمنية. لا يعيد الرسم. فقط هيكل سوق قوي، معلم بوضوح.
الملخص
ملخص الذكاء الاصطناعي
The SwingHighLow indicator for cTrader automatically detects and plots significant swing highs and lows on price charts, aiding traders in identifying market structure, price reversals, and support/resistance zones. It highlights confirmed swing highs in red and swing lows in blue with clear point markers. The indicator includes an adjustable strength parameter that allows users to filter market noise or tighten signal sensitivity according to their trading preferences. It is suitable for use across all timeframes and supports analysis for various markets including Forex, indices, commodities, stocks, and cryptocurrencies such as BTCUSD, EURUSD, and XAUUSD. The tool is designed to assist with trend analysis, spotting reversals, and identifying breakout traps without repainting, providing consistent and reliable market structure visualization.
ملف تعريف المؤشر
تقييمات العملاء
4.3
التقييمات: 3
5 | 67 % | |
4 | 0 % | |
3 | 33 % | |
2 | 0 % | |
1 | 0 % |
تقييمات العملاء
July 22, 2025
Good support for rules for swing point analysis. it helps identify turning points and cleaner structure, especially when used for reviewing reversals, pullbacks and swing zones. Swing points look better after 3 pivots, especially when the 0.5 Fib area agrees with structure. The level is useful when it supports the market story.
July 21, 2025
July 21, 2025
Practical choice for demo for a more controlled workflow. It helps with reviewing reversals, pullbacks and swing zones, but the signal still needs broader context. Swing points look better after 3 pivots, especially when the 0.5 Fib area agrees with structure. I would still keep manual review in the process.
مناقشة
الأسئلة الشائعة
BTCUSD
Forex
Signal
Breakout
Indices
EURUSD
Supertrend
Commodities
Stocks
XAUUSD
ATR
يتم توفير المنتجات المتاحة من خلال cTrader Store، بما في ذلك روبوتات التداول والمؤشرات والإضافات، من قبل مطوري الطرف الثالث وإتاحتها لأغراض الوصول المعلوماتي والفني فقط. cTrader Store ليس وسيطًا ولا يقدم نصائح استثمارية أو توصيات شخصية أو أي ضمان للأداء المستقبلي.


السعر
منذ 03/01/2025
638.03K
حجم التداول
21.34K
الربح بالبيب
15
المبيعات