
SupertrendChannels
مؤشر
الإصدار 1.0، Jul 2025
Windows, Mac
4.5
التقييمات: 2
الوصف
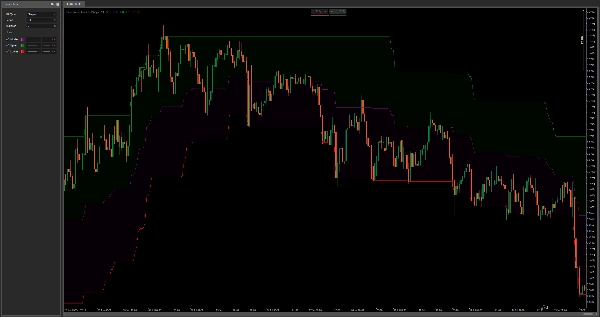
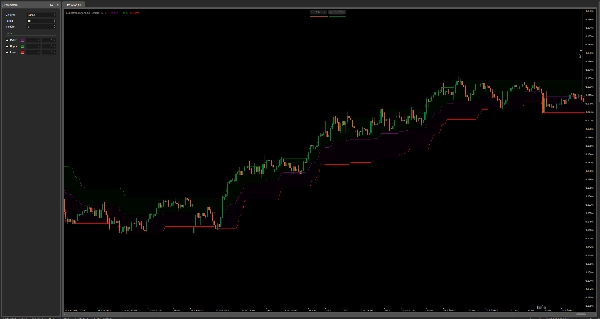
قنوات سوبرتريند هي مؤشر تراكبي مخصص مصمم لمساعدة المتداولين على التعرف بصريًا على مناطق الدعم والمقاومة الديناميكية، إشارات الدخول، و مستويات وقف الخسارة المتحركة باستخدام منطق يعتمد على ATR.
يقوم المؤشر برسم ثلاثة خطوط:
- الشريط العلوي (أخضر) – يعمل كمقاومة ديناميكية أو وقف خسارة متحرك للصفقات الطويلة.
- الشريط السفلي (أحمر) – يعمل كدعم ديناميكي أو وقف خسارة متحرك للصفقات القصيرة.
- الخط الأوسط (بنفسجي) – يعمل كمستوى ارتداد متوسط أو نقطة دخول محتملة.
يحسب الأشرطة باستخدام متوسط النطاق الحقيقي (ATR) مضروبًا في عامل يحدده المستخدم (Multiplier) ويضيف/يطرح ذلك من أعلى/أدنى الشمعة الحالية. يتم تطبيق طريقة تمليس (نوع MA قابل للاختيار) على ATR لضبط الاستجابة.
كيفية الاستخدام:
- الدخول: ابحث عن نقاط الدخول بالقرب من الخط الأوسط أثناء فترات التماسك أو بعد إشارات العبور.
- وقف الخسارة المتحرك: استخدم الأشرطة العلوية/السفلية كمناطق خروج ديناميكية لتثبيت الأرباح مع امتداد الاتجاهات.
- الدعم والمقاومة: تعمل هذه الأشرطة كمناطق متكيفة تعكس التقلبات الأخيرة وتساعد في تحديد نقاط الانعطاف المحتملة.
على عكس أشرطة بولينجر القياسية، يرتكز هذا النهج على القصوى السعرية بالإضافة إلى التقلب، وليس المتوسط المتحرك، مما يجعله أكثر استجابة في بيئات الاتجاه وأكثر تكيفًا للتداول التقديري أو الخوارزمي.
الملخص
ملف تعريف المؤشر
تقييمات العملاء
4.5
التقييمات: 2
5 | 50 % | |
4 | 50 % | |
3 | 0 % | |
2 | 0 % | |
1 | 0 % |
تقييمات العملاء
July 26, 2025
the idea is fine, just do not expect it to print perfect entries. Win rate means less without average R.
July 25, 2025
The reason it feels usable is the plan does not get lost as quickly. The market context still matters.
مناقشة
الأسئلة الشائعة
يتم توفير المنتجات المتاحة من خلال cTrader Store، بما في ذلك روبوتات التداول والمؤشرات والإضافات، من قبل مطوري الطرف الثالث وإتاحتها لأغراض الوصول المعلوماتي والفني فقط. cTrader Store ليس وسيطًا ولا يقدم نصائح استثمارية أو توصيات شخصية أو أي ضمان للأداء المستقبلي.


السعر
منذ 03/01/2025
638.03K
حجم التداول
21.34K
الربح بالبيب
15
المبيعات