
TradingViewMACD
مؤشر
3 عمليات الشراء
الإصدار 1.0، Feb 2025
Windows, Mac
5.0
التقييمات: 1

الوصف
مؤشر TradingViewMACD
قم بتحسين استراتيجية التداول الخاصة بك مع مؤشر TradingViewMACD القابل للتخصيص بدرجة عالية، المصمم لمنصة cAlgo. تجمع هذه الأداة القوية بين المرونة والدقة اللازمة لتحسين تحليلك للسوق.
الميزات الرئيسية:
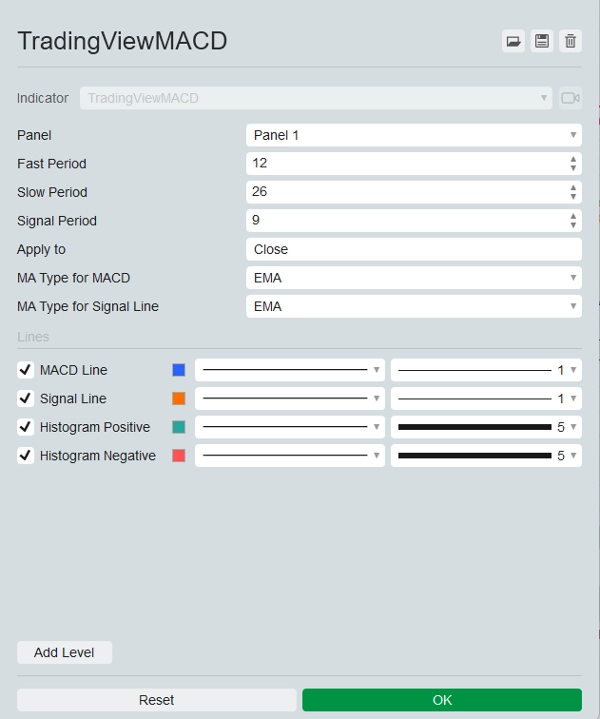
- معلمات قابلة للتخصيص:
-
- الفترة السريعة: قم بضبط فترة المتوسط المتحرك السريع لتناسب أسلوب تداولك.
- الفترة البطيئة: قم بتكوين فترة المتوسط المتحرك البطيء لتحسين دقة الإشارة.
- فترة الإشارة: اضبط فترة خط الإشارة لضبط نقاط الدخول والخروج بدقة.
- السعر المطبق: اختر من بين الأسعار الافتتاحية، الأعلى، الأدنى، الإغلاق، المتوسط، النموذجي، أو المرجح لتطبيق المؤشر.
- أنواع متعددة من المتوسطات المتحركة:
-
- اختر بين المتوسط المتحرك البسيط (SMA) والمتوسط المتحرك الأسي (EMA) لكل من خط MACD وخط الإشارة، مما يوفر مرونة في تحليلك.
- المخرجات البصرية:
-
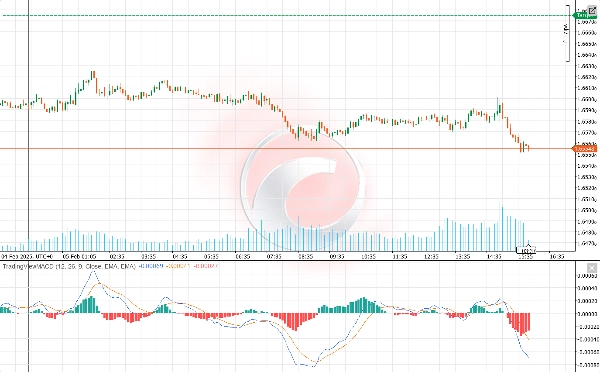
- خط MACD: معروض بلون أزرق بارز لسهولة الرؤية.
- خط الإشارة: مميز باللون البرتقالي الزاهي لتمييزه بسهولة عن خط MACD.
- الرسم البياني: يميز بين القيم الإيجابية والسلبية بالألوان الخضراء والحمراء على التوالي، مما يوفر تمثيلاً بصريًا واضحًا لزخم السوق.
- رؤى محسنة للسوق:
-
- يقوم المؤشر بحساب الفرق بين المتوسطات المتحركة السريعة والبطيئة لتوليد خط MACD.
- يحسب خط الإشارة كمتوسط متحرك لخط MACD.
- يمثل الرسم البياني بصريًا الفرق بين خط MACD وخط الإشارة، مما يساعدك على تحديد إشارات الشراء والبيع المحتملة.
- سهل الاستخدام:
-
- سهل التثبيت والتكوين، مما يسمح للمتداولين من جميع المستويات بالاستفادة من ميزاته المتقدمة.
- توثيق شامل ودعم العملاء لضمان تجربة سلسة.
أطلق العنان للإمكانات الكاملة لاستراتيجية التداول الخاصة بك مع مؤشر TradingViewMACD. حسّن تحليلك للسوق، اتخذ قرارات مستنيرة، وابقَ في الصدارة باستخدام هذه الأداة الأساسية للتداول.
الملخص
ملخص الذكاء الاصطناعي
The TradingViewMACD indicator for the cAlgo platform is a customizable technical analysis tool designed to enhance market analysis. It calculates the difference between fast and slow moving averages to generate the MACD line, computes a signal line as the moving average of the MACD line, and displays a histogram representing the difference between these lines to help identify potential buy and sell signals.
Key features include adjustable parameters such as fast period, slow period, signal period, and applied price (open, high, low, close, median, typical, or weighted). Users can select between Simple Moving Average (SMA) and Exponential Moving Average (EMA) types for both the MACD and signal lines, providing analytical flexibility.
Visual outputs consist of a blue MACD line, an orange signal line, and a histogram with green and red colors indicating positive and negative momentum, respectively. The indicator is designed for ease of installation and configuration, supported by comprehensive documentation and customer support to accommodate traders of all experience levels.
ملف تعريف المؤشر
تقييمات العملاء
5.0
التقييمات: 1
5 | 100 % | |
4 | 0 % | |
3 | 0 % | |
2 | 0 % | |
1 | 0 % |
تقييمات العملاء
November 9, 2025
TradingView MACD brings the familiar feel straight to cTrader 🚀 - smooth, light, and 100% accurate to the original. Perfect for traders switching from TV who love clean momentum signals. Missing alerts, but flawless for classic trend and divergence play.
مناقشة
الأسئلة الشائعة
Signal
MACD
يتم توفير المنتجات المتاحة من خلال cTrader Store، بما في ذلك روبوتات التداول والمؤشرات والإضافات، من قبل مطوري الطرف الثالث وإتاحتها لأغراض الوصول المعلوماتي والفني فقط. cTrader Store ليس وسيطًا ولا يقدم نصائح استثمارية أو توصيات شخصية أو أي ضمان للأداء المستقبلي.


السعر
منذ 22/11/2024
133
المبيعات
2.58K
التثبيتات المجانية