الوصف
تم تصميم هذا المؤشر لأداء تحليل الانحدار غير الخطي المتعدد باستخدام أربعة متغيرات مستقلة: أسعار الإغلاق والافتتاح والارتفاع والانخفاض.
إليك المكونات والوظائف:
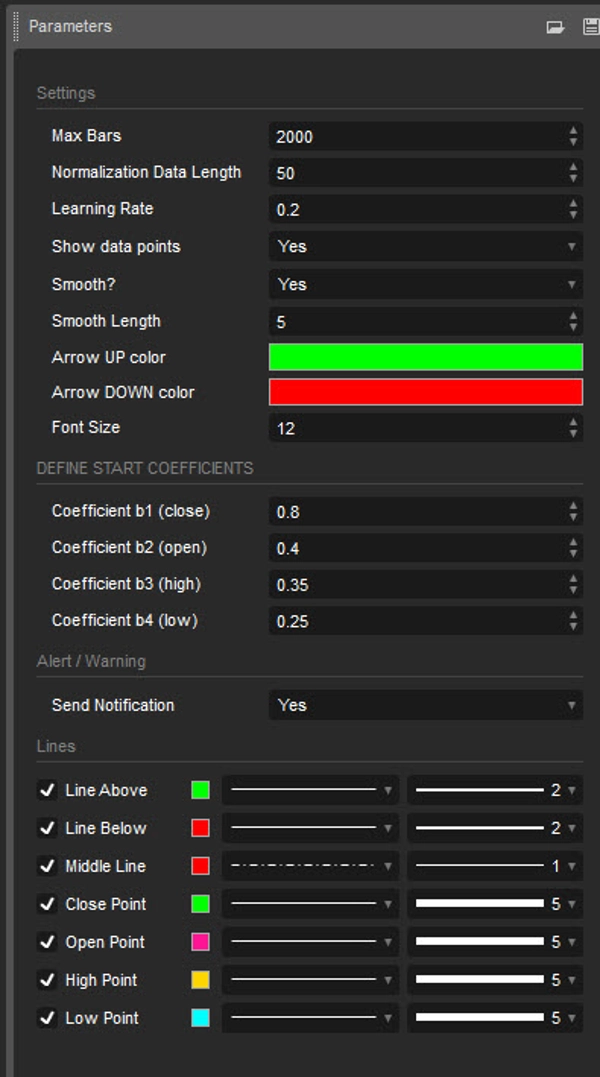
المدخلات:
- طول بيانات التطبيع: طول البيانات المستخدمة للتطبيع.
- معدل التعلم: معدل تعلم الخوارزمية من الأخطاء.
- عرض نقاط البيانات: عرض رسم بيانات الإدخال المطابقة (الإغلاق، الافتتاح، الارتفاع، الانخفاض)
- تنعيم؟: خيار لتنعيم الناتج.
- طول التنعيم: طول التنعيم إذا تم التفعيل.
- تحديد معاملات البداية: المعاملات الأولية لمعادلة الانحدار.
تطبيع البيانات:
يقوم السكريبت بتطبيع بيانات الإدخال إلى نطاق بين 0 و 1 باستخدام أعلى وأدنى القيم ضمن طول محدد.
الانحدار غير الخطي:
يحسب معادلة الانحدار باستخدام معاملات الإدخال والبيانات المطابقة. المعادلة المستخدمة هي مجموع مرجح للمتغيرات المستقلة، مع تعديل المعاملات بشكل تكراري باستخدام الانحدار التدرجي لتقليل الأخطاء.
حساب الخطأ:
يقوم السكريبت بحساب الخطأ بين القيم الفعلية والمتوقعة.
الانحدار التدرجي:
يتم تحديث المعاملات بشكل تكراري باستخدام الانحدار التدرجي لتقليل الخطأ.
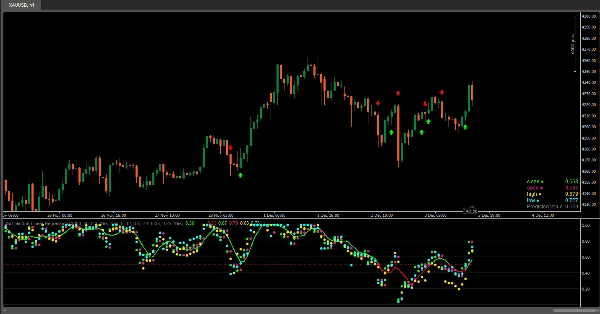
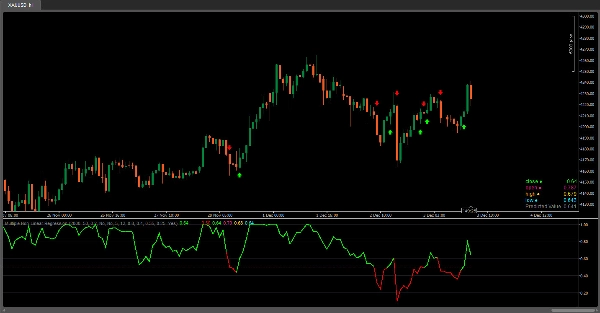
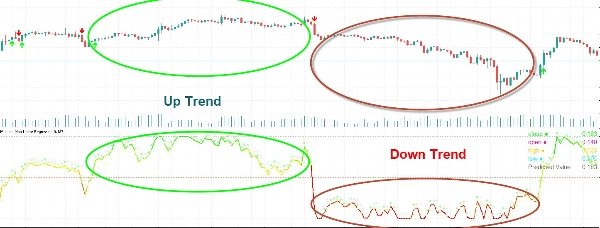
التصور:
- رسم بيانات الإدخال المطابقة (الإغلاق، الافتتاح، الارتفاع، الانخفاض).
- يوفر المؤشر تصورًا لقيم البيانات المطابقة (الإغلاق، الافتتاح، الارتفاع، الانخفاض) على شكل علامات دائرية على الرسم البياني، مما يسمح للمستخدمين بملاحظة المواقع النسبية لهذه القيم بسهولة بالنسبة لبعضها البعض وخط الانحدار.
- رسم خط الانحدار.
- تدرج لوني على خط الانحدار بناءً على قيمته وألوان الأعمدة.
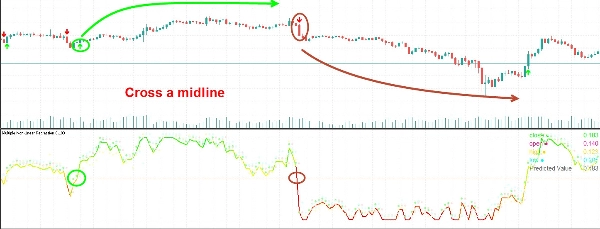
- عرض بيانات الإدخال المطابقة والقيمة المتوقعة في جدول.
- إشارات لتقاطع مع الخط الوسيط (0.5).
التفسير:
يمكن للمستخدمين تفسير خط الانحدار وتقاطعاته مع الخط الوسيط (0.5) كإشارات لفرص شراء أو بيع محتملة.
يساعد هذا المؤشر المستخدمين على تحليل العلاقة بين متغيرات متعددة واتخاذ قرارات تداول بناءً على تحليل الانحدار. يمكن تعديل المعاملات والبارامترات لضبط أداء النموذج وفقًا لظروف السوق المحددة.
الملخص
تقييمات العملاء
5 | 100 % | |
4 | 0 % | |
3 | 0 % | |
2 | 0 % | |
1 | 0 % |