
Fair Value Gaps
مؤشر
1.04K التنزيلات
الإصدار 1.0، Dec 2025
Windows, Mac
5.0
التقييمات: 1
الوصف
مؤشر فجوة القيمة العادلة (FVG)
نظرة عامة
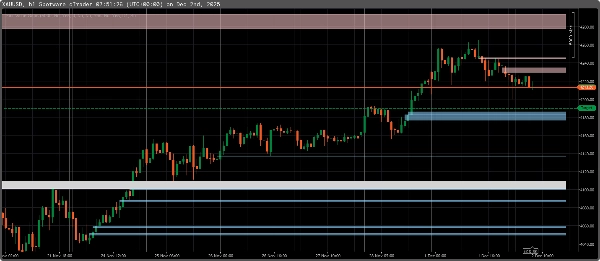
يقوم مؤشر فجوة القيمة العادلة (FVG) بتحديد عدم الكفاءات في حركة السعر حيث يحدث خلل بسبب الشراء أو البيع العدواني. غالبًا ما يتم إنشاء هذه الفجوات بواسطة المتداولين المؤسسيين والمال الذكي، مما يترك مناطق قد يعود السعر إليها لاحقًا "لملء" الخلل قبل متابعة اتجاهه.
الميزات الرئيسية:
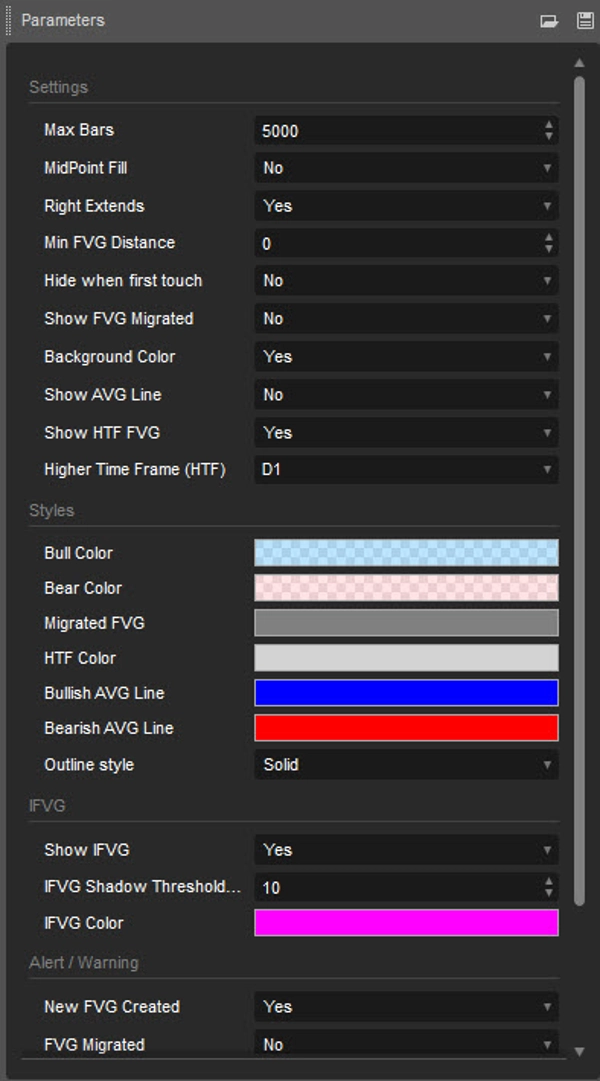
- الكشف التلقائي عن فجوات القيمة العادلة – يبرز المؤشر فجوات القيمة العادلة عبر أطر زمنية مختلفة.
- دعم متعدد الأطر الزمنية – عرض فجوات القيمة العادلة من أطر زمنية أعلى على مخططات الأطر الزمنية الأدنى.
كيف يعمل:
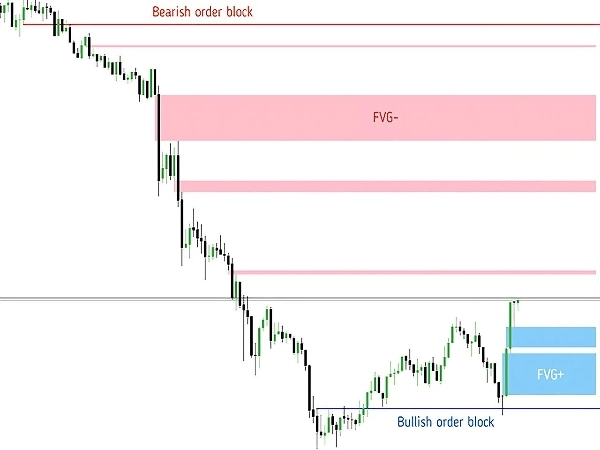
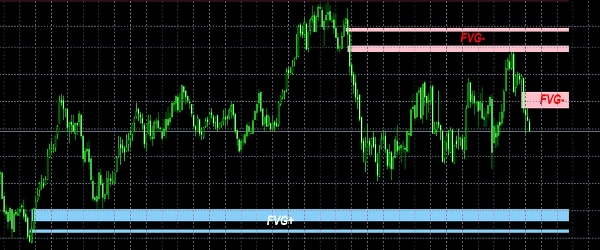
- يقوم المؤشر بمسح تحركات السعر ويكشف الفجوات حيث لا يتداخل الارتفاع لشمعة مع الانخفاض لشمعتين تاليين (فجوة قيمة عادلة صاعدة) أو العكس (فجوة قيمة عادلة هابطة).
- يتم تمييز هذه المناطق كمناطق سيولة محتملة حيث قد يعود السعر إليها قبل الاستمرار في الاتجاه السائد.
- يساعد المؤشر المتداولين في التعرف على آثار المال الذكي، من خلال دمج فجوات القيمة العادلة مع BOS و CHoCH وكتل الأوامر.
كيفية التداول باستخدام فجوات القيمة العادلة:
- استراتيجية الدخول: انتظر عودة السعر وتفاعله مع منطقة فجوة القيمة العادلة (رفض، دعم، أو مقاومة).
- التداول بالتوافق: ادمج مع BOS وكتل الأوامر ومسح السيولة لزيادة الدقة.
- أهداف جني الأرباح: ضع في اعتبارك تجمع السيولة التالي أو مستوى الهيكل الرئيسي.
من يجب أن يستخدم هذا المؤشر؟
- متداولو المال الذكي و ICT
- متداولو حركة السعر والمؤسسات
- المتداولون السريعون والمتأرجحون
الملخص
ملخص الذكاء الاصطناعي
The Fair Value Gap (FVG) Indicator detects price action inefficiencies caused by aggressive buying or selling, often linked to institutional traders. It automatically identifies fair value gaps—areas where a candle’s high does not overlap with the low of two candles ahead (bullish FVG) or vice versa (bearish FVG)—across multiple timeframes, allowing users to view higher timeframe gaps on lower timeframe charts. These gaps represent potential liquidity zones where price may revisit before continuing its trend. The indicator helps traders recognize smart money footprints by combining FVG analysis with Break of Structure (BOS), Change of Character (CHoCH), and Order Blocks. Trading strategies using this indicator involve waiting for price reactions at FVG zones for entry, using confluence with other smart money concepts for accuracy, and targeting subsequent liquidity pools or major structure levels for take profit. It is suitable for smart money, ICT, price action, institutional traders, scalpers, and swing traders operating in markets including Forex, Crypto, and indices such as BTCUSD, EURUSD, XAUUSD, and NAS100.
ملف تعريف المؤشر
تقييمات العملاء
5.0
التقييمات: 1
5 | 100 % | |
4 | 0 % | |
3 | 0 % | |
2 | 0 % | |
1 | 0 % |
تقييمات العملاء
December 10, 2025
A clean and accurate Fair Value Gap detector. Highlights bullish/bearish FVGs with minimal lag and great clarity. Useful for intraday and swing ICT/SMC setups. Can get busy on lower TFs, but filtering helps. Alerts, MTF mode and FVG state tracking would take it to the next level.
مناقشة
الأسئلة الشائعة
BTCUSD
Forex
Scalping
EURUSD
Fair Value Gap
SMC
Crypto
XAUUSD
NAS100
يتم توفير المنتجات المتاحة من خلال cTrader Store، بما في ذلك روبوتات التداول والمؤشرات والإضافات، من قبل مطوري الطرف الثالث وإتاحتها لأغراض الوصول المعلوماتي والفني فقط. cTrader Store ليس وسيطًا ولا يقدم نصائح استثمارية أو توصيات شخصية أو أي ضمان للأداء المستقبلي.


السعر
38
المبيعات
2.39K
التثبيتات المجانية