
Side Volume Profile
Indicador
11 compras
Versão 1.0, Aug 2025
Windows, Mac
4.3
Avaliações: 3
Desde 26/05/2025
381M
Volume negociado
60.65K
Pips ganhos
14
Vendas
1.38K
Instalações gratuitas
Descrição
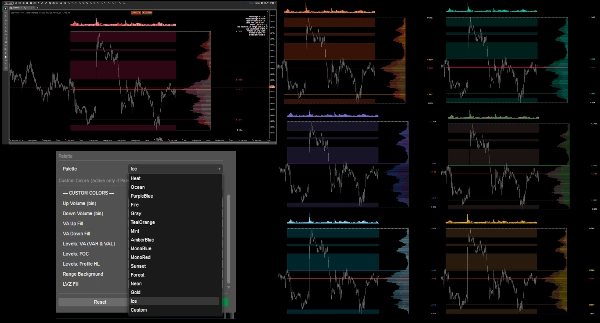
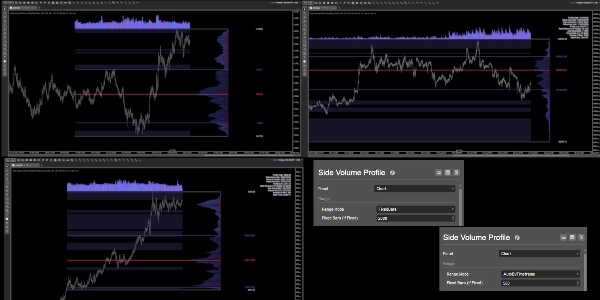
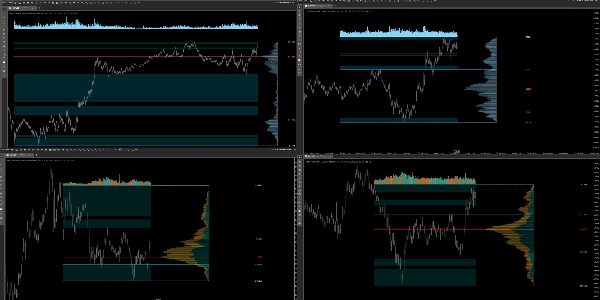
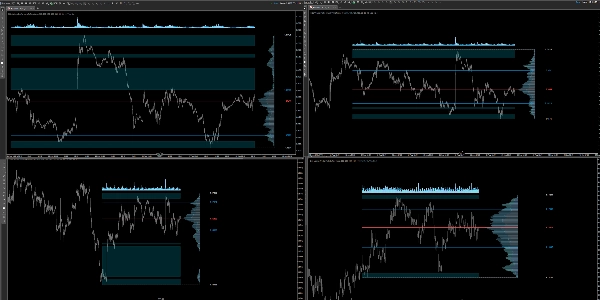
Um Perfil de Volume do lado direito, que está sempre fixo nas últimas barras e não pula quando você move o gráfico. Ele calcula o volume por preço em um intervalo escolhido (automático pelo período de tempo ou uma contagem fixa de barras), mostra POC, VAH/VAL, limites do perfil (Alta/Baixa), destaca zonas de baixo volume (LVZ) e desenha um histograma de volume com EMA acima do intervalo (deslocamento em pips). Inclui um painel de estatísticas no canto superior direito, várias paletas de alto contraste além de cores personalizadas, opacidade global dos bins, controles de largura/deslocamento e espessura/estilo por linha. Construído para legibilidade e desempenho.
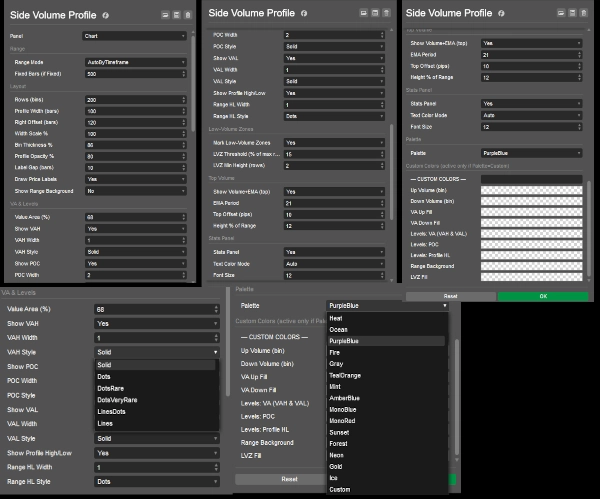
- Intervalo: AutoPorPeríodo ou BarrasFixas.
- Layout: Linhas (bins), Largura do Perfil / Escala de Largura, Deslocamento Direito, Espessura do Bin, Espaço do Rótulo, opacidade do perfil; fundo opcional do intervalo.
- VA & Níveis: Percentual da Área de Valor, alternar VAH/POC/VAL, largura e estilo da linha por nível; Alta/Baixa do perfil.
- Zonas de Baixo Volume: Limite (% da linha máxima) e altura mínima (linhas).
- Volume Máximo: Período EMA, altura (% do intervalo), deslocamento padrão 10 pips.
- Paleta/Personalizado: Escolha um tema ou defina suas próprias cores (VAH = VAL).
- Painel de Estatísticas: Alternar, tamanho da fonte
Documentação do indicador
Resumo
Perfil do indicador
Avaliações de clientes
4.3
Avaliações: 3
5 | 33 % | |
4 | 67 % | |
3 | 0 % | |
2 | 0 % | |
1 | 0 % |
Avaliações de clientes
Conversa
Perguntas frequentes
BTCUSD
Forex
Indices
EURUSD
Commodities
GBPUSD
NZDUSD
Prop
Fair Value Gap
SMC
Crypto
Stocks
XAUUSD
NAS100
USDJPY
VWAP
Os produtos disponíveis através da cTrader Store, incluindo bots de negociação, indicadores e plugins, são fornecidos por programadores terceiros e são disponibilizados apenas para fins informativos e de acesso técnico. A cTrader Store não é um corretor e não fornece aconselhamento em matéria de investimento, recomendações pessoais ou qualquer garantia de desempenho no futuro.


Preço
Desde 26/05/2025
381M
Volume negociado
60.65K
Pips ganhos
14
Vendas
1.38K
Instalações gratuitas