
Market Entropy
インジケーター
107 ダウンロード数
バージョン 1.0、Aug 2025
Windows、Mac
説明
Market Entropy は、市場の組織化を定量化し、Order → Transition → Chaos にわたるレジームシフトを示す二重指標(オシレーター+オプションの価格オーバーレイ)です。第二のライン、Trendness (DC) を追加し、真のトレンドとボラティリティスクイーズを区別します。
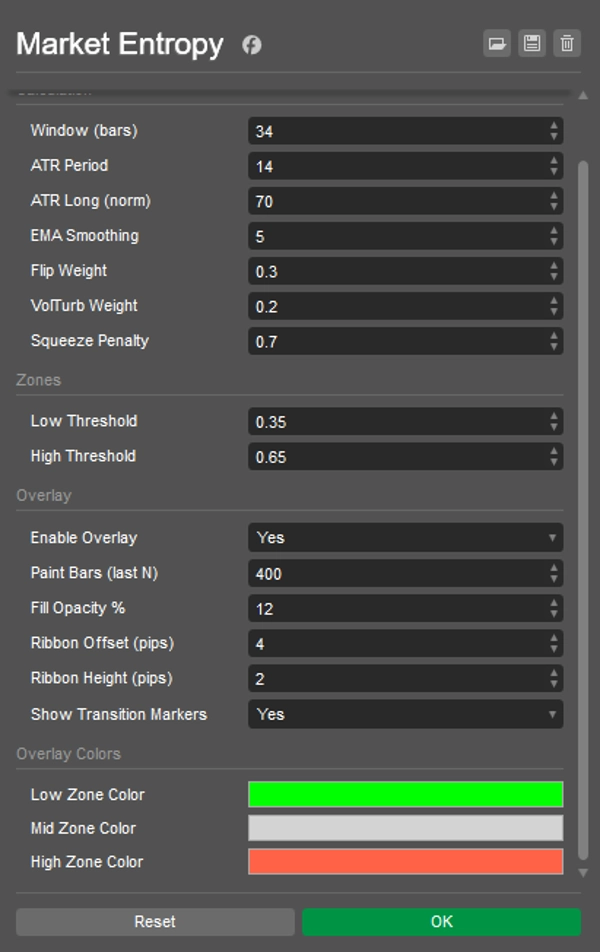
仕組み:
- OHLCVの構成要素のみを使用: DC(方向の一貫性)、FlipRate(符号の反転)、Volatility_n(ATR/ATRlong)、VolumeTurb(ΔVolumeの標準偏差)。
- 生のエントロピー:
E0 = 0.5*(1-DC) + 0.3*(FlipRate*VolN) + 0.2*VolumeTurb)。 - アンチスクイーズ項はATR圧縮中にEを下げ、最終的にエントロピー ∈ [0..1]となりEMAで平滑化されます。
- マーカー:
-
- CRYSTAL — LowThr以下へのクロス(秩序の出現:トレンドまたはブレイク前のスクイーズ)。
- DISSOLVE — HighThr以上へのクロス(秩序の崩壊:カオス/トレンドの衰退)。
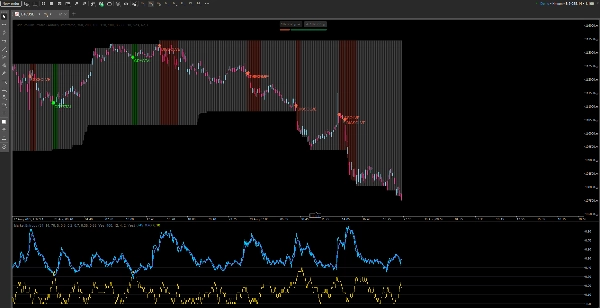
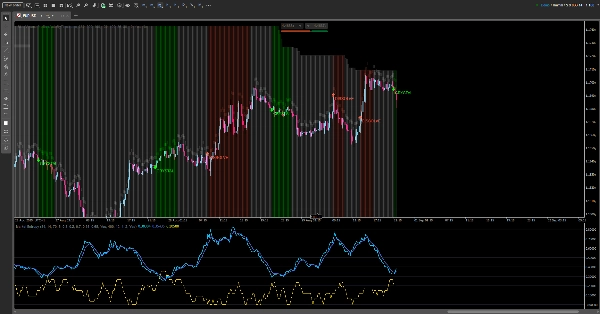
表示内容:
- パネルには:Entropy、Entropy(EMA)、Trendness (DC)、Low/Highの閾値、ゾーンの背景。
- チャート上(切替可能):状態色のバー、ハイの上の細いリボン、およびCRYSTAL/DISSOLVEマーカー。
読み方ガイド:
- E < LowThr → 秩序:
-
- 高いDCで → 組織されたトレンド;
- 低いATRで → スクイーズ(ブレイクを予想)。
- LowThr…HighThr → 過渡期:構造形成中;解決を待つ。
- E > HighThr → 混沌:不確実性/トレンドの衰退;安易な継続エントリーは避ける。
プレイブック:
- スクイーズ → CRYSTAL → ブレイク/リテスト — ブレイクアウトを取引する。
- トレンド → DISSOLVE — ポジションを縮小するかリスクを引き締める。
概要
インジケーターのプロフィール
カスタマーレビュー
0.0
レビュー: 0
カスタマーレビュー
この商品にはまだレビューがありません。お使いになったことがある方は、ぜひレビューをお願いします。
ディスカッション
よくあるご質問
cTrader Storeで入手可能な取引ボット、インジケーター、プラグインなどの商品は、第三者の開発者が提供するものであり、情報と技術の取得のみを目的としてご利用いただけます。cTrader Storeはブローカーではなく、投資助言や個人的な推奨を行うことも、将来のパフォーマンスを保証することもありません。


これも好きかも


![「High-Low Divergence [Iridio Capital]」ロゴ](https://cdn.ctrader.com/image/webp/443c4661-7abb-40f1-842f-4b6ec560649b_40914)


価格
登録日 26/05/2025
449.3M
取引数量
61.1K
獲得pips
15
販売
1.43K
無料インストール