
Session Plus HL
インジケーター
2 購入済
バージョン 1.0、Nov 2025
Windows、Mac
3.5
レビュー: 2
説明
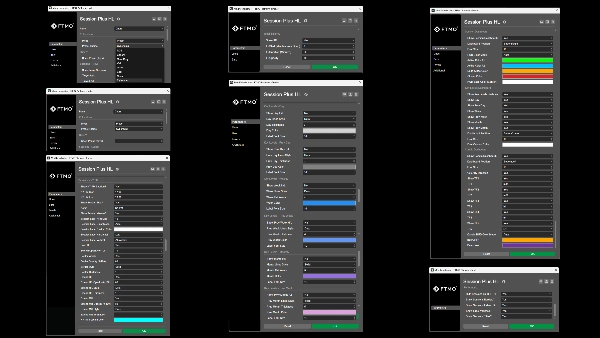
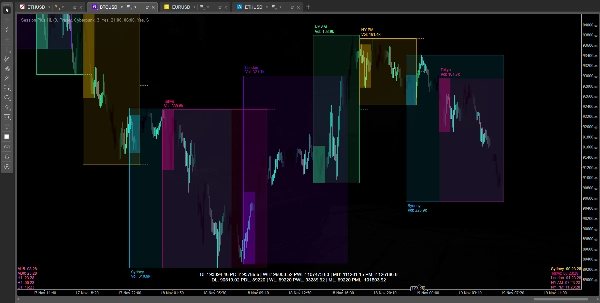
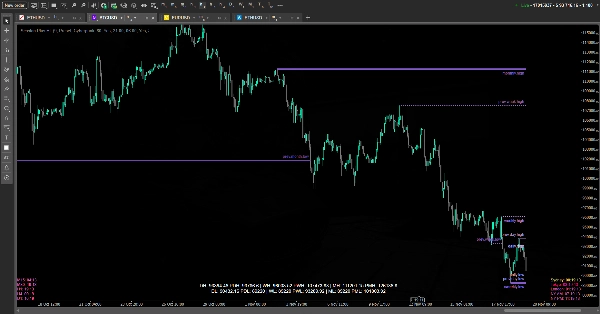
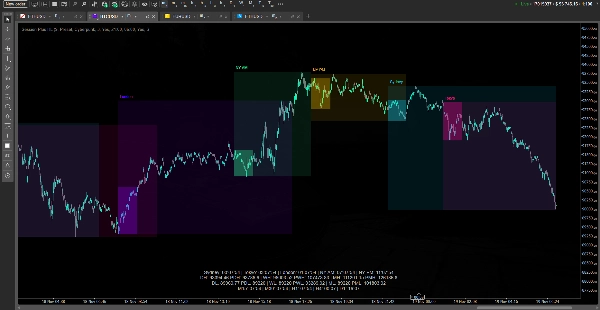
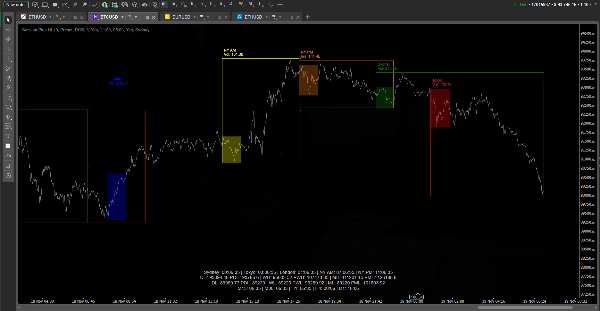
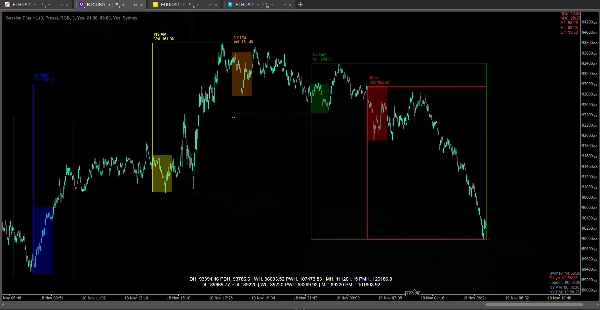
このインジケーターは、日中トレーダー向けに市場構造と時間ベースのコンテキストを視覚化するために設計されています。チャート上に主要な取引セッション(シドニー、東京、ロンドン、ニューヨークの午前/午後)を自動的にボックスとしてプロットし、それらの高値/安値およびオプションの中間レベルを表示し、各セッション内の初期バランス(IB)範囲をハイライトすることもできます。また、より高い時間軸からの重要な参照レベル—現在および前日の週/月の高値と安値—を描画し、チャート上のラインとコンパクトなダッシュボードの両方で表示するため、価格が最近の流動性プールに対してどこにあるかを常に確認できます。
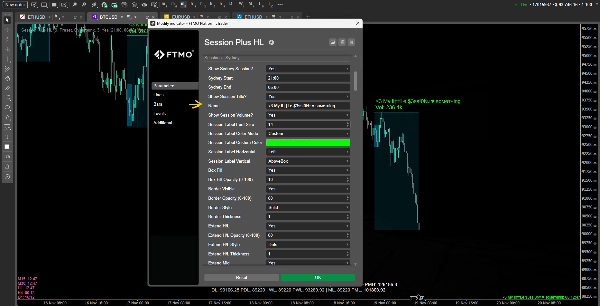
さらに、このインジケーターは複数のHUDを提供します:各セッションの開始または終了までの残り時間を示すセッションダッシュボード、すべての日次/週次/月次の高値/安値をまとめたキー・レベル・ダッシュボード、複数の高時間軸のローソク足の残り時間と強気/弱気の状態を示すキャンドルダッシュボードです。すべてのビジュアルはテーマ設定可能(カラープリセットまたはカスタムカラー)、パフォーマンス調整可能(高いTFでのセッション非表示、重い動的拡張の代わりにラインのスタブ制御)であり、チャートを混雑させたり遅くしたりすることなく、流動性スイープ、セッション範囲、タイミングの分析をサポートすることを目的としています。
概要
AIによる概要
Session Plus HL is an intraday trading indicator that visualizes market structure and time-based context by automatically plotting key trading sessions—Sydney, Tokyo, London, New York AM/PM—as boxes on the chart. It displays each session's high, low, and optional mid levels, and can highlight the Initial Balance (IB) range within sessions. The indicator also draws key reference levels from higher timeframes, including current and previous day, week, and month highs and lows, shown as lines on the chart and summarized in a compact dashboard. Additional HUDs include a session dashboard indicating time until session open or close, a key levels dashboard summarizing daily/weekly/monthly highs and lows, and a candle dashboard showing remaining time and bullish/bearish status for multiple higher timeframe candles. Visual elements are customizable with color presets or custom colors and can be optimized for performance by controlling session visibility and line extensions. The tool supports analysis of liquidity sweeps, session ranges, and timing across various markets including Forex, indices, commodities, stocks, and cryptocurrencies such as BTCUSD, EURUSD, GBPUSD, and XAUUSD.
インジケーターのプロフィール
カスタマーレビュー
3.5
レビュー: 2
5 | 0 % | |
4 | 50 % | |
3 | 50 % | |
2 | 0 % | |
1 | 0 % |
カスタマーレビュー
November 21, 2025
Not a hands off answer, but it has a clear role. It helps with smart money style analysis, while the weak spot is that zones still need manual validation.
November 20, 2025
ngl, this one makes sense if you are not trying to yolo every signal. Better keeping it on demo first and see how it behaves when liquidity moves gets messy. The warning sign is when the trade plan starts feeling forced.705 caution area.
ディスカッション
よくあるご質問
BTCUSD
Forex
Signal
Breakout
Indices
EURUSD
Commodities
GBPUSD
NZDUSD
Prop
ZigZag
Scalping
Supertrend
Fair Value Gap
SMC
Crypto
Stocks
XAUUSD
NAS100
ATR
USDJPY
VWAP
cTrader Storeで入手可能な取引ボット、インジケーター、プラグインなどの商品は、第三者の開発者が提供するものであり、情報と技術の取得のみを目的としてご利用いただけます。cTrader Storeはブローカーではなく、投資助言や個人的な推奨を行うことも、将来のパフォーマンスを保証することもありません。


価格
登録日 26/05/2025
388.58M
取引数量
60.75K
獲得pips
15
販売
1.41K
無料インストール