
Donchian Channel Pro
インジケーター
バージョン 1.0、Aug 2025
Windows、Mac
4.5
レビュー: 2
説明
ドンチャン(ブレイクアウト)戦略を使った取引方法
- 買いは価格がN期間の高値(上限)を突破したとき。
- 売りは価格がN期間の安値(下限)を突破したとき。
- 保有はトレンドが続く間ポジションを維持し、反対方向のブレイクアウトまたはトレーリングストップで決済。
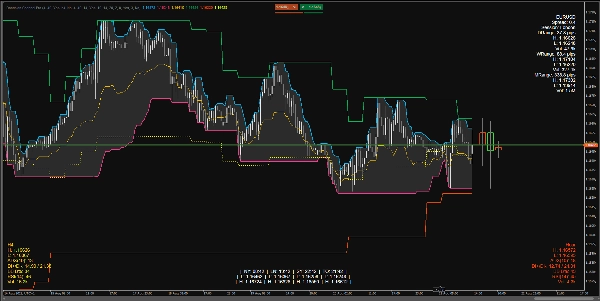
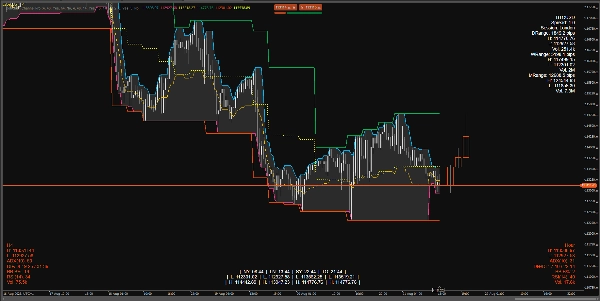
チャート上のインジケーターの表示内容
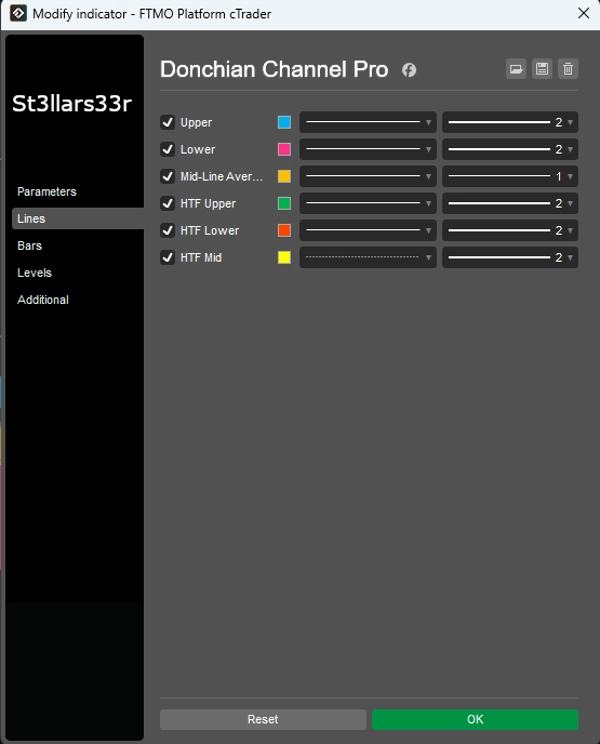
現在の時間軸(TF)上のドンチャン:
- 上限:上限チャネルバーの最高価格。
- 下限:下限チャネルバーの最安価格。
- 中間:上限と下限の中間点。
HTFオーバーレイ:より高い時間軸のドンチャンラインをチャートに重ねて表示:
- HTF上限、 HTF下限、 HTF中間
- HTFキャンドルHUD:現在のTFの最後のバーの右側に固定された高時間軸のキャンドルを表す長方形。
下部/上部のHUD(ヘッズアップディスプレイ):
- 右上:シンボル情報+日次/週次/月次のレンジパネル。
- 左下:HTF HUD(高時間軸の指標)。
- 右下:中間TF HUD(中間時間軸の指標)。
- 中央下:セッションクロック+各セッションの高値/安値(持続的)。
各HUDの表示内容
右上(Top Right)
- シンボル名
- スプレッド:ピップ単位のスプレッド。
- セッション:現在のアクティブセッション(指定時間に基づく)。
- 日次/週次/月次レンジ:ピップ単位の日次/週次/月次レンジ。
- 高値/安値/出来高:該当期間の高値/安値および総出来高。
左下(Bottom Left)— HTF HUD
- 時間軸名(例:H4、D1など)
- 高値/安値:最後(またはアクティブな)HTFバーの現在の高値/安値。
- ADX(n)、DI+/DI-:トレンド指標。
- BB B%:HTFのボリンジャーバンドに対する現在価格の位置(0は下限付近、100は上限付近)。
- RSI(n)
- 出来高:HTFの出来高。
- HUDカラー:
-
- 緑:レンジが上昇中(DI+とADXが上昇)。
- 赤:下降圧力が増加中(DI-が上昇)。
- 黄:中立/未定義。
右下(Bottom Right)— 中間TF HUD
- HTF HUDと同様ですが、中間時間軸(ミッドタイムフレーム)用です。
中央下(Bottom Center)— クロック+セッション高値/安値
- 時間:NY、LN、SY、TOの時間。
- 安値/高値:各セッションごと。
- 持続的ロジック:セッションが非アクティブの場合、最後に完了したセッションの高値/安値を表示。新しいセッションが始まると値はリセットされ再計算されます。
パラメーターと使い方
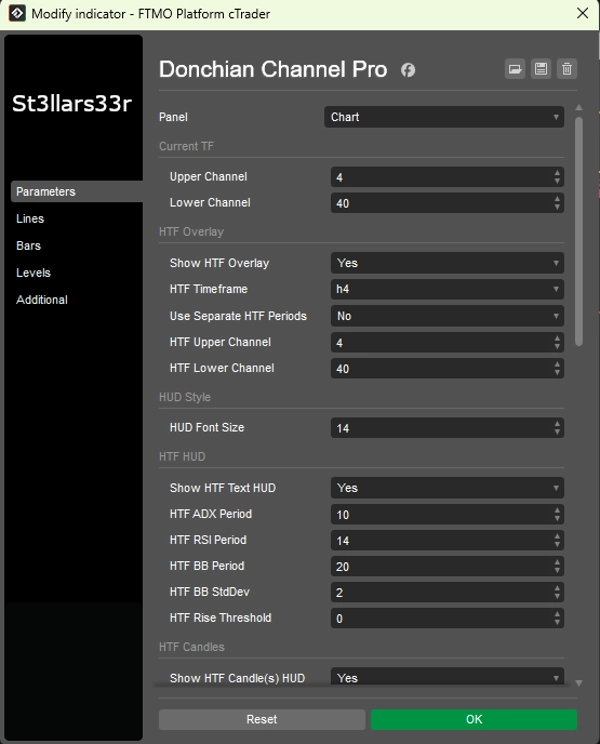
グループ:現在のTF(現在のドンチャン)
- 上限チャネル:上限チャネルのバー数。値が大きいほど更新頻度が低く、ラインが平坦になります。
- 下限チャネル:下限チャネルのバー数。
グループ:HTFオーバーレイ(高時間軸ドンチャンオーバーレイ)
- HTFオーバーレイ表示:チャート上にHTFラインを表示します。
- HTF時間軸:高い時間軸を選択(例:Hour4)。
- 別々のHTF期間を使用:trueの場合、HTF上限/下限は独自のパラメーターを使用。falseの場合、現在の上限/下限を使用。
- HTF上限チャネル:HTFの上限チャネルの長さ。
- HTF下限チャネル:HTFの下限チャネルの長さ。
グループ:HUDスタイル
- HUDフォントサイズ:すべてのHUD(右上、左下、右下、中央下)のフォントサイズ。
グループ:HTF HUD(左下)
- HTFテキストHUD表示:HTFのテキストHUDを表示。
- HTF ADX期間:ADX/DI期間。大きいほど滑らかでノイズが少なくなるが反応は遅くなる。
- HTF RSI期間:RSI期間。
- HTF BB期間:ボリンジャーバンド期間。
- HTF BB標準偏差:BBの標準偏差乗数(クラシックは2.0)。
- HTF上昇閾値:上昇指標への感度(HUDカラーに影響)。
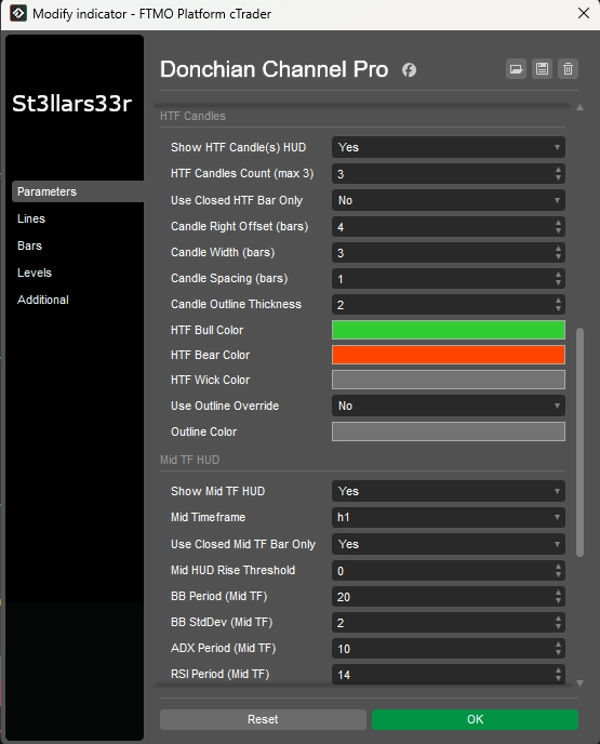
グループ:HTFキャンドル(右、最後のバー付近)
- HTFキャンドルHUD表示:右側にHTFキャンドルを表示。
- HTFキャンドル数(最大3):HTFキャンドルの数(1~3)。
- 閉じたHTFバーのみ使用:trueの場合、閉じたHTFキャンドルのみ使用(安定した値)。falseの場合、現在のオープンキャンドルも含む。
- キャンドル右オフセット(バー単位):現在のTFの最後のバーから右へのバー単位のオフセット(アンカー)。
- キャンドル幅(バー単位):現在のTFバー単位でのキャンドル長方形の幅。
- キャンドル間隔(バー単位):キャンドル間の間隔。
- キャンドルアウトラインの太さ:キャンドルのアウトラインの太さ。
- HTFブルカラー / HTFベアカラー:強気/弱気キャンドルの色。
- HTFウィックカラー:ウィックの色。
- アウトラインオーバーライド使用:trueの場合、キャンドル本体はアウトラインカラーで描画され、ブル/ベアの塗りつぶしなし。
- アウトラインカラー:アウトラインオーバーライドがtrueのときのアウトラインの色。
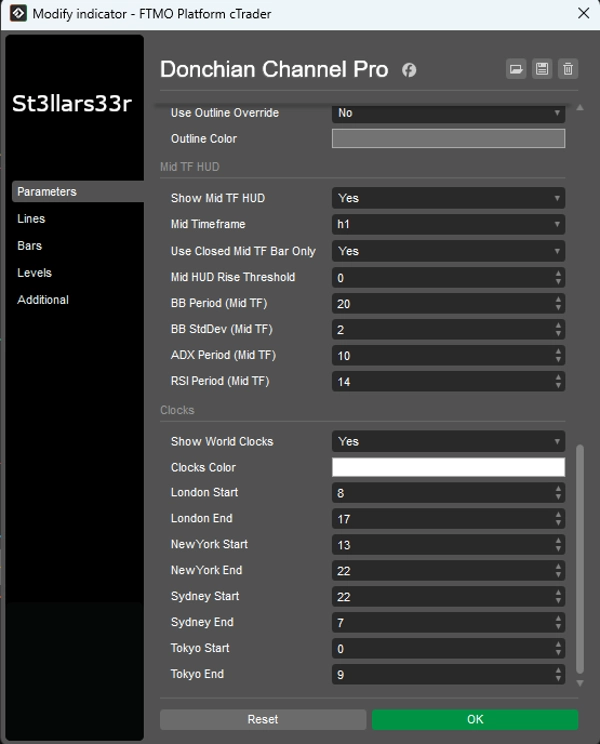
グループ:中間TF HUD(右下)
- 中間TF HUD表示:中間時間軸のHUDを有効にします。
- 中間時間軸:中間時間軸を選択(例:Minute15)。
- 閉じた中間TFバーのみ使用:HTFと同様ですが、中間TF用。
- 中間HUD上昇閾値:中間TF HUDの色感度。
- BB期間(中間TF)、BB標準偏差(中間TF):中間TFのボリンジャーバンド設定。
- ADX期間(中間TF)、RSI期間(中間TF):中間TFのADXおよびRSI期間。
グループ:クロック(中央下)
- ワールドクロック表示:クロックとセッション高値/安値のブロックを表示。
- クロックカラー:クロック/セッションのテキスト色。
- ロンドン開始 / ロンドン終了:ロンドンセッションの開始/終了時間。
- ニューヨーク開始 / ニューヨーク終了:ニューヨーク用。
- シドニー開始 / シドニー終了:シドニー用。
- 東京開始 / 東京終了:東京用。
クロック:都市の実際の現地時間を表示(OSのタイムゾーンを使用し、フォールバックオフセットあり)。
- セッションのアクティビティ(および高値/安値)の計算はブローカーのサーバー時間(Server.Time)を使用します。サーバーがUTCでない場合、セッション時間がずれる可能性があるため、サーバーに合わせて開始/終了時間を調整してください。
- セッションが深夜をまたぐ場合(終了時間 < 開始時間)、インジケーターは自動的に日付の切り替えを考慮します。
- セッションが非アクティブの場合、最後に完了したセッションの高値/安値を表示し、新しいセッションが始まるとデータはリセットされ再計算されます。
概要
インジケーターのプロフィール
カスタマーレビュー
4.5
レビュー: 2
5 | 50 % | |
4 | 50 % | |
3 | 0 % | |
2 | 0 % | |
1 | 0 % |
カスタマーレビュー
August 31, 2025
The setup still needs chart context before any serious size. It should stay in the support stack.
August 23, 2025
the review step feels less vague, but the setup still needs a person behind it, and manual context still matters.
ディスカッション
よくあるご質問
BTCUSD
Forex
Signal
Breakout
Indices
EURUSD
Commodities
GBPUSD
NZDUSD
Prop
Scalping
Supertrend
Crypto
Stocks
XAUUSD
NAS100
USDJPY
cTrader Storeで入手可能な取引ボット、インジケーター、プラグインなどの商品は、第三者の開発者が提供するものであり、情報と技術の取得のみを目的としてご利用いただけます。cTrader Storeはブローカーではなく、投資助言や個人的な推奨を行うことも、将来のパフォーマンスを保証することもありません。


価格
登録日 26/05/2025
386.5M
取引数量
60.75K
獲得pips
14
販売
1.4K
無料インストール