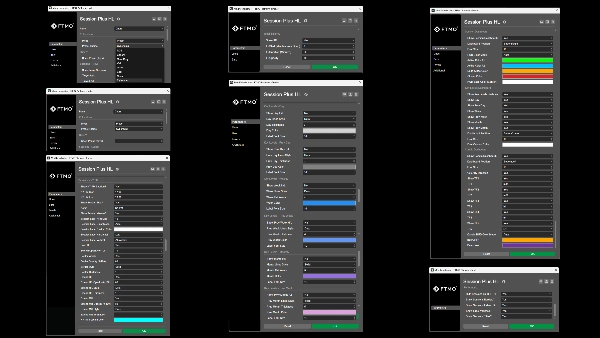
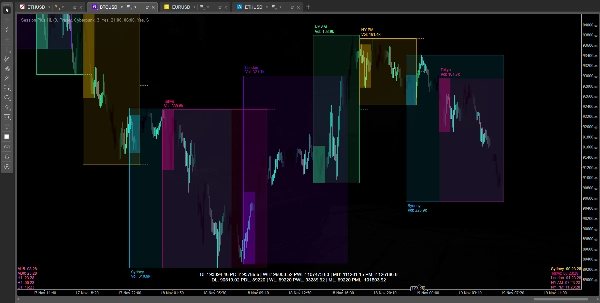
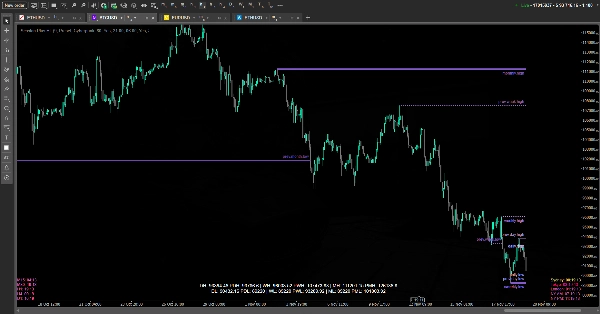
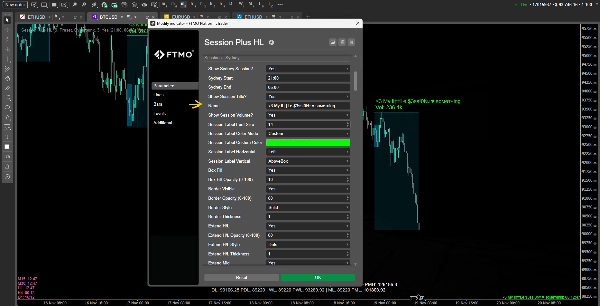
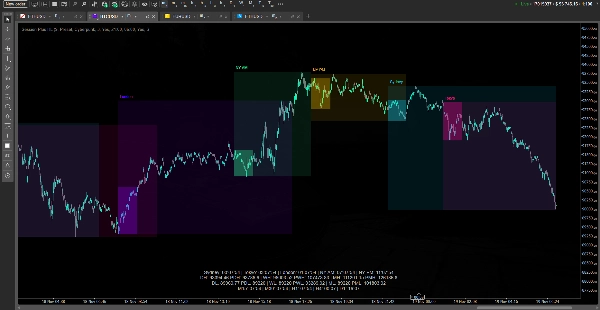
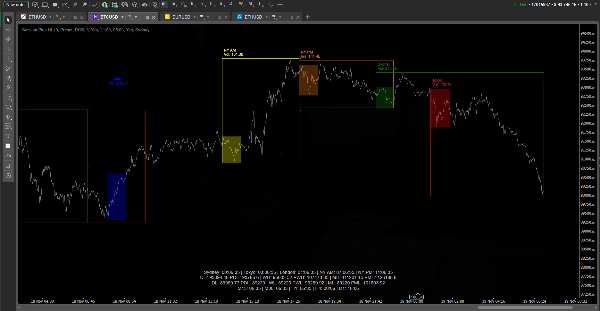
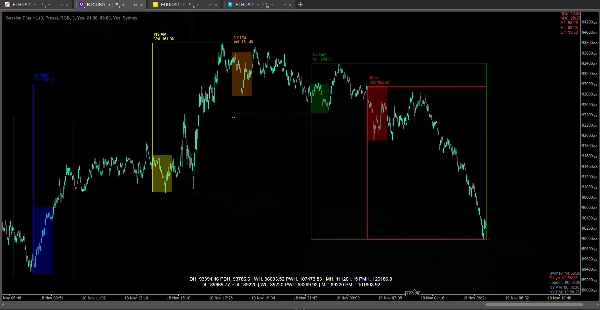
Индикатор
NAS100
NZDUSD
Breakout
XAUUSD
FVG
Commodities
Forex
Signal
EURUSD
GBPUSD
BTCUSD
SMC
VWAP
ZigZag
Indices
Prop
ATR
Stocks
Supertrend
Crypto
USDJPY
Scalping
Session Plus HL
19/11/2025
1
Desktop
С 26/05/2025
Торгуемый объем
225.85M
Выигранные пипы
34.86K
Продажи
9
Бесплатные установки
417
Загруженное изображение продукта "Session Plus HL"Загруженное изображение продукта "Session Plus HL"Загруженное изображение продукта "Session Plus HL"Загруженное изображение продукта "Session Plus HL"Загруженное изображение продукта "Session Plus HL"Загруженное изображение продукта "Session Plus HL"Загруженное изображение продукта "Session Plus HL"

This indicator is designed to visualize market structure and time-based context for intraday traders. It automatically plots key trading sessions (Sydney, Tokyo, London, New York AM/PM) as boxes on the chart, shows their high/low and optional mid levels, and can highlight an Initial Balance (IB) range inside each session. It also draws key reference levels from higher timeframes — current and previous day/week/month highs and lows — and displays them both as lines on the chart and as a compact dashboard, so you always see where price is relative to recent liquidity pools.

On top of that, the indicator provides several HUDs: a session dashboard showing how long remains until each session opens or closes, a key levels dashboard summarizing all daily/weekly/monthly H/L values, and a candle dashboard that shows time remaining in candles on multiple higher timeframes and their bullish/bearish state. All visuals are theme‑able (color presets or custom colors), can be tuned for performance (hiding sessions on higher TFs, controlling line stubs instead of heavy dynamic extensions), and are meant to support analysis of liquidity sweeps, session ranges, and timing without cluttering or slowing the chart.

0.0
Отзывы: 0
Отзывы покупателей
У этого продукта еще нет отзывов. Уже попробовали его? Поделитесь впечатлениями!
Больше от этого автора
Индикатор
NAS100
Indices
Prop
+6
VolumeThermometer
Heatmap of intra-HTF volume (POC/VA) built from LTF tick data; paints current candle and auto-loads visible history.
Side Volume Profile
Right-anchored cTrader Volume Profile with VAH/VAL/POC, LVZ, top volume+EMA, themes, and fast, readable visuals.
Индикатор
ZigZag
VWAP
FVG
+4
Candle Volume Profile Demo
Candle Volume Profile for Crypto
Candles_Painter
Overlay HTF context on any chart: color bars by HTF and draw filled HTF bodies with optional High/Low lines.
Moving Average Plus
10 configurable moving averages: choose type, period, color per line; single price source for all.
Индикатор
NAS100
NZDUSD
XAUUSD
+14
Donchian Channel Pro
Tracks N-period highs/lows, HTF overlay, HUDs with ADX, RSI, session clocks. Customizable for precise trading.
Market Entropy
Market entropy + DC. Spot crystallization/chaos shifts with an optional on-chart overlay.
TrendStrengthSignals
Edge-aware clouds + Pro HUD: better entries, calmer exits, adaptive risk.
Индикатор
NAS100
NZDUSD
XAUUSD
+12
VSA
Pro VSA tool with 3 modes: Fixed Ratios, Standard Deviation & Contextual VSA.
Индикатор
NAS100
NZDUSD
XAUUSD
+16
Candle Timer Toolbox
A multi-TF panel with candle timers, sessions, ticker, spread & 15+ themes. Fully customizable.
Вам также может понравиться
Индикатор
Stocks
Forex
Crypto
+1
Market Structure SNR + Auto Bias
Market Structure Indicator – Your Trading Map in a Noisy Market. No more Panicking Which one, Where, Why and How.
Популярный
$ 17
Индикатор
Grid
NAS100
NZDUSD
+15
TS_Pivot
Those who are involved in trading know how important it is to take into account the previous session. With Order Block
Индикатор
Indices
Commodities
Forex
Institutional FVG Zones MTF with Confluence
Professional Fair Value Gaps with multitimeframe spot on
Индикатор
Grid
RSI
Breakout
+14
StopATR
Displays a dynamic stop loss line based on the Average True Range (ATR), helping traders visualize volatility-based risk
Популярный
$ 100
Индикатор
NAS100
RSI
NZDUSD
+18
HAIQuantum-V10
The HAI Quantum V10 is an advanced indicator designed for technical analysis
Индикатор
NAS100
Indices
NZDUSD
+9
Heatmap Pro
Heatmap Pro analiza la volatilidad, el volumen y la acción del precio para "pintar" tu gráfico con zonas de color.
Индикатор
VWAP
ZigZag
RSI
+6
RSI T3 overbought and oversold area
Индикатор
XAUUSD
Commodities
Forex
+2
IM_AngleIndicator
Indicator that calculates the slope of a moving average (SMA) and displays the value of the slope in degrees
Alpha Sentiment Pro
Alpha Sentiment Pro - See the Market's Pulse Before It Moves
[Hamster-Coder] Pivot Points MTF
[Hamster-Coder] Pivot Points (Multi Time Frame)
Индикатор
NAS100
NZDUSD
Breakout
+12
Multi_TF Candlestick Chart Overlay
Perfect for traders who demand a clear overview of multiple timeframes at a glance.
Buy and sell indicator
Buy and Sell Signals
Sharpe Ratio
Sharp Rate Indikator
Индикатор
Grid
NAS100
NZDUSD
+17
SmartFractalZigZagPlus
Smart fractal + Fibonacci with statistical S/R heatmap and Triple Confluence signals for high‑probability trades.
Tradingview Economic Calendar onn Chart
Customizable window inside your platform, access to any website Calendar
Индикатор
NAS100
NZDUSD
XAUUSD
+12
Dynamic Swing Anchored VWAP
Индикатор
NAS100
XAUUSD
Breakout
+14
Market_Profile_Prodessional
Market Profile TPO for cTrader — full auction logic, IB, POC, VA zones, histogram and O/X markers with time
VegaXLR - Candlestick Patterns Pro
Identify 34 candlestick patterns, track trends across timeframes, and get instant alerts with this powerful trading tool