
Описание
Fixed Range Volume Profile Pro
Этот индикатор создан для трейдеров, которые хотят простой способ увидеть, где объем действительно имеет значение.
Вместо того чтобы гадать уровни поддержки и сопротивления, вы можете определить диапазон и мгновенно увидеть, где рынок проводил большую часть времени. Он выделяет ключевые уровни: POC, VAH и VAL, чтобы вы могли сосредоточиться на областях, которые с большей вероятностью отреагируют.
Что он показывает
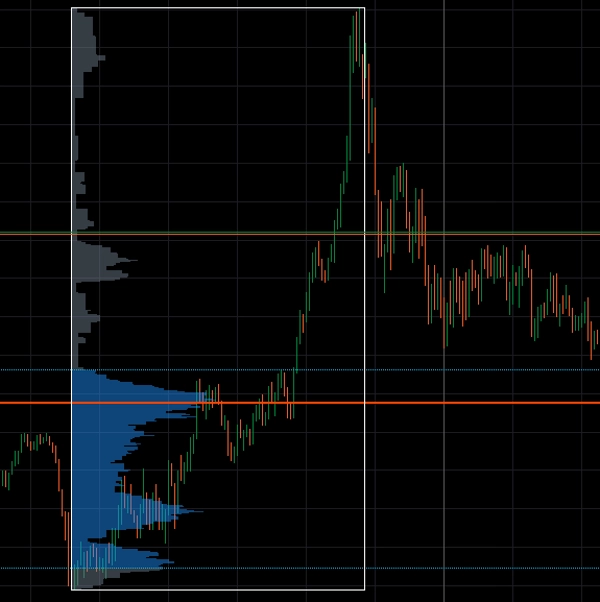
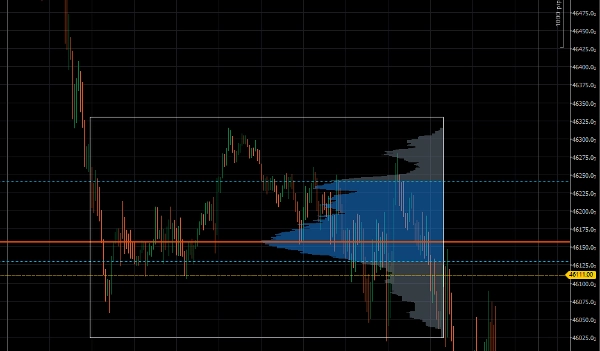
После выбора диапазона индикатор строит профиль объема на основе этого участка графика.
Он выделяет:
- POC (Point of Control)
Цена, по которой был совершён наибольший объем торгов. Этот уровень часто действует как магнит. - VAH (Value Area High)
Верхняя граница области, где происходила большая часть торговой активности. - VAL (Value Area Low)
Нижняя граница той же области стоимости.
Эти уровни помогают быстро увидеть:
- Где цена «справедлива»
- Где она может развернуться
- Где могут произойти прорывы
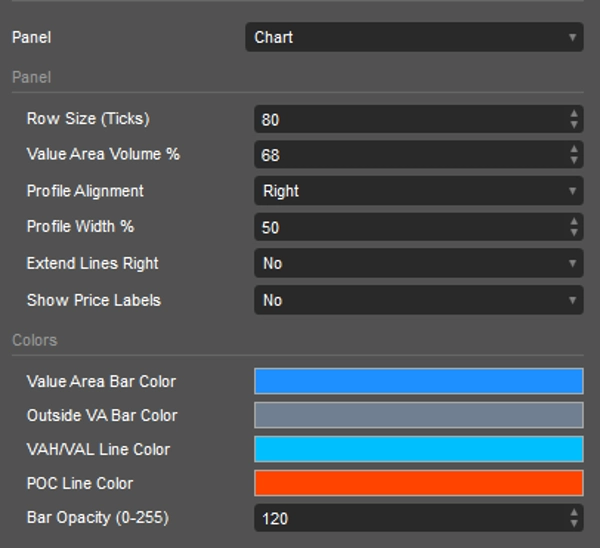
Настройки:
- Размер строки (тиков)
Контролирует, насколько детальным будет профиль
Меньше = больше деталей, Больше = плавнее - Процент объема области стоимости (по умолчанию 68)
Определяет, какая часть объема считается «стоимостью» - Выравнивание профиля
Перемещает профиль влево или вправо - Ширина профиля %
Регулирует, насколько широкий выглядит гистограмма - Продлить линии вправо
Сохраняет видимость POC / VAH / VAL в будущем ценовом движении - Показывать ценовые метки
Отображает точные уровни цен
Для кого это:
- Скальперы, ищущие точные уровни
- Интрадей-трейдеры (US30, NASDAQ, Forex)
- Все, кто привык к инструменту фиксированного диапазона TradingView
Заключительное замечание
Этот инструмент лучше всего работает в сочетании с анализом ценового действия.
Он не даст вам сигналов и не скажет, когда входить, но покажет где имеет смысл обратить внимание.
Сводка
Users select a specific range on the chart, and the indicator generates a volume profile histogram for that segment. Adjustable settings include row size (tick granularity), value area volume percentage (default 68%), profile alignment, histogram width, line extension into future price, and price label display.
FRVP is suitable for scalpers, intraday traders, and those familiar with TradingView’s fixed range volume profile tool. It supports various markets including Forex, indices, commodities, stocks, and cryptocurrencies. The indicator does not provide trade signals but serves as a visual tool to focus attention on important volume levels when combined with price action analysis.
Отзывы покупателей
5 | 50 % | |
4 | 50 % | |
3 | 0 % | |
2 | 0 % | |
1 | 0 % |


