
H Capital Liquidity Map Lite V1
インジケーター
254 ダウンロード数
バージョン 1.0、Mar 2026
Windows、Mac
説明
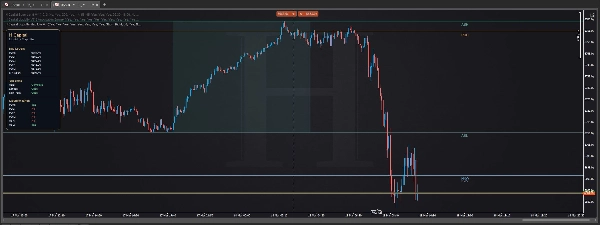
H Capital Liquidity Map Liteは、混乱なく構造を求めるトレーダーのために設計された無料のチャートツールです。
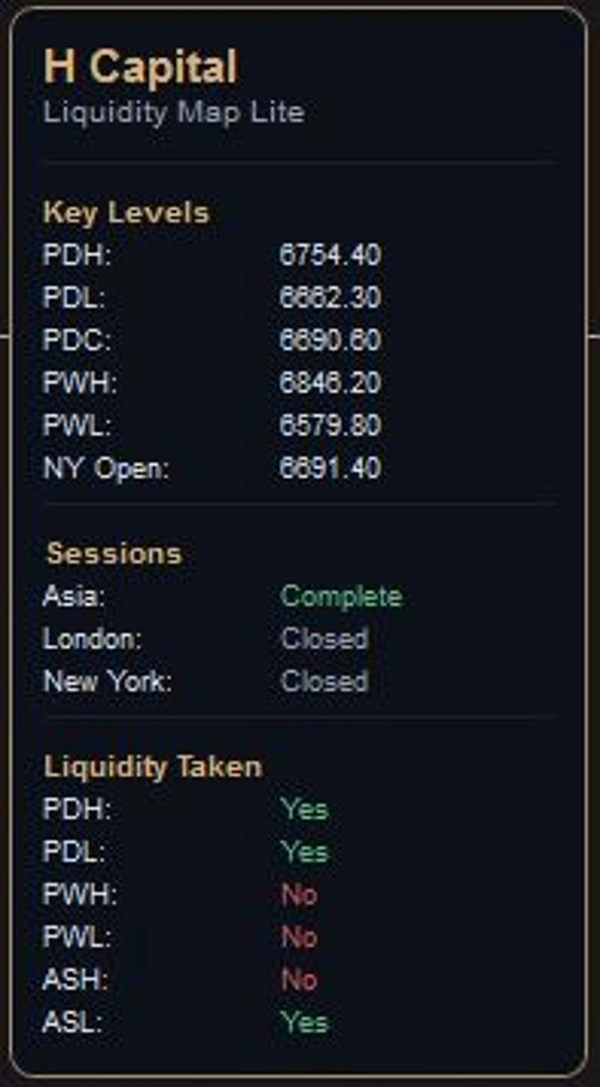
多くのトレーダーが毎日監視する主要な市場参照をマッピングします:
- 前日の高値
- 前日の安値
- 前日の終値
- 先週の高値
- 先週の安値
- ニューヨークオープン
- アジアセッションのレンジ
- 流動性取得状況
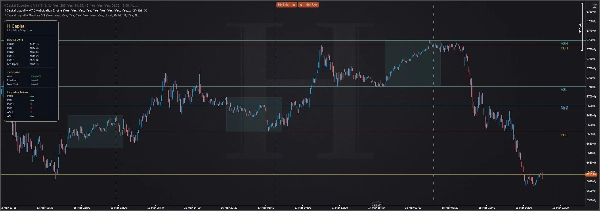
目的はシンプルです:トレーダーに実行前のクリーンな枠組みを提供すること。
シグナルでチャートを溢れさせるのではなく、H Capital Liquidity Map Liteはコンテキスト構築に役立つレベルとセッション参照に焦点を当てています。インターフェースはプレミアムなミニマリストスタイルで設計されており、情報が一目でアクセス可能なままチャートの可読性を保ちます。
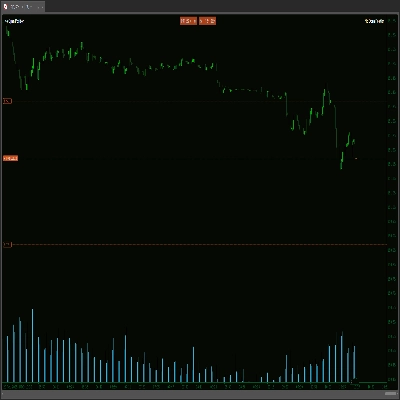
最適な対象:
- インデックストレーダー
- 外国為替トレーダー
- 金属トレーダー
- 流動性ベースのトレーダー
- クリーンなチャートを好むトレーダー
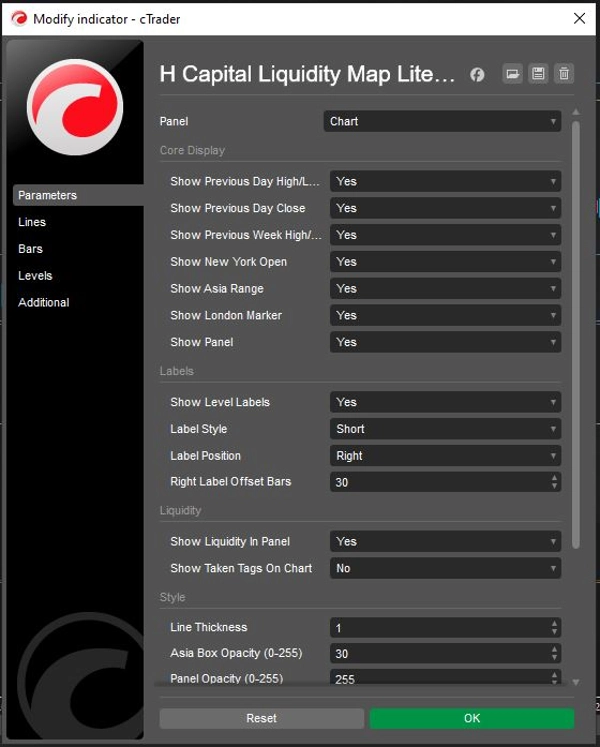
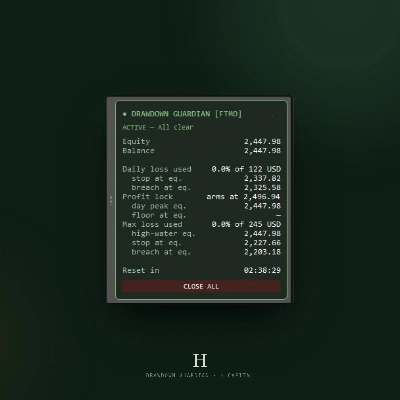
機能:
- 主要な日次および週次の流動性レベルをマッピング
- セッション構造を表示
- 重要なレベルが取得されたかどうかを追跡
- プレミアムなチャート上パネルで情報を整理
機能しないこと:
- 買い/売りシグナルを生成しない
- 実行判断の代わりにはならない
- アラートエンジンとして機能しない
これはシグナルツールではありません。プロフェッショナルな市場マップです。
概要
AIによる概要
H Capital Liquidity Map Lite is a charting tool designed to provide traders with a clear, uncluttered view of key daily and weekly liquidity levels. It displays important market references such as the previous day’s high, low, and close; previous week’s high and low; New York open; Asia session range; and liquidity taken status. The tool organizes this information within a minimalist, premium on-chart panel to maintain readability and quick accessibility.
This indicator is suited for traders in indices, forex, metals, and those focusing on liquidity-based strategies who prefer clean chart layouts. It helps build market context by mapping session structures and tracking whether significant levels have been breached. The tool does not generate buy or sell signals, replace execution judgment, or function as an alert system. Instead, it serves as a professional market map to support informed trading decisions.
This indicator is suited for traders in indices, forex, metals, and those focusing on liquidity-based strategies who prefer clean chart layouts. It helps build market context by mapping session structures and tracking whether significant levels have been breached. The tool does not generate buy or sell signals, replace execution judgment, or function as an alert system. Instead, it serves as a professional market map to support informed trading decisions.
インジケーターのプロフィール
カスタマーレビュー
0.0
レビュー: 0
カスタマーレビュー
この商品にはまだレビューがありません。お使いになったことがある方は、ぜひレビューをお願いします。
ディスカッション
よくあるご質問
Prop
Forex
Indices
Commodities
Crypto
Grid
cTrader Storeで入手可能な取引ボット、インジケーター、プラグインなどの商品は、第三者の開発者が提供するものであり、情報と技術の取得のみを目的としてご利用いただけます。cTrader Storeはブローカーではなく、投資助言や個人的な推奨を行うことも、将来のパフォーマンスを保証することもありません。
この作成者の他の商品


![「[Hamster-Coder] Bollinger Bands」ロゴ](https://cdn.ctrader.com/image/webp/21d8e5d6-fb11-4bac-b9ee-cd05c2b76804_30327)


価格
登録日 09/03/2026
1.58M
取引数量
15.43K
獲得pips
254
無料インストール