
Moving Average Plus
مؤشر
144 التنزيلات
الإصدار 1.0، Aug 2025
Windows, Mac
الوصف
عالمي
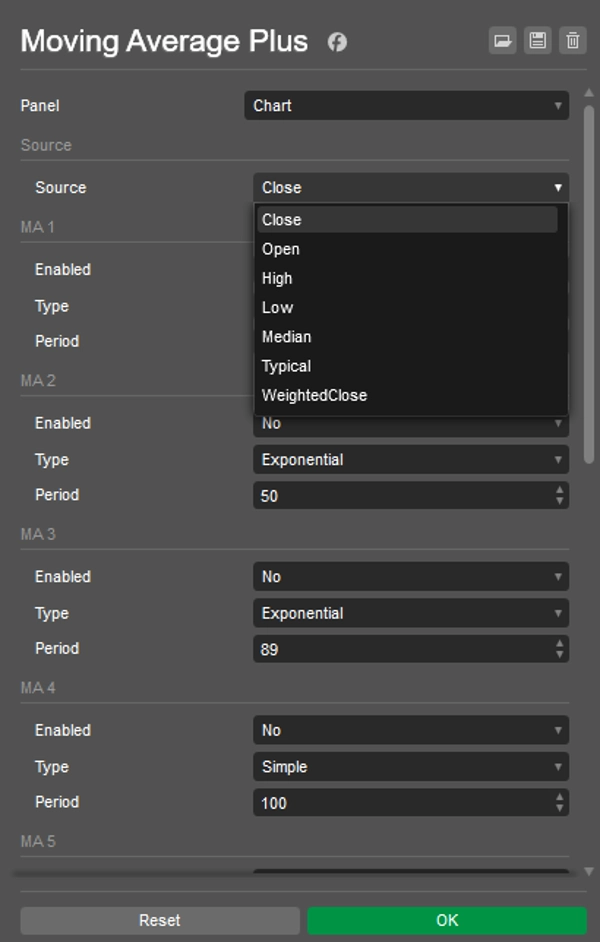
- المصدر – إدخال السعر المستخدم من قبل جميع الخطوط: الإغلاق، الافتتاح، الأعلى، الأدنى، المتوسط، النموذجي، أو الإغلاق المرجح.
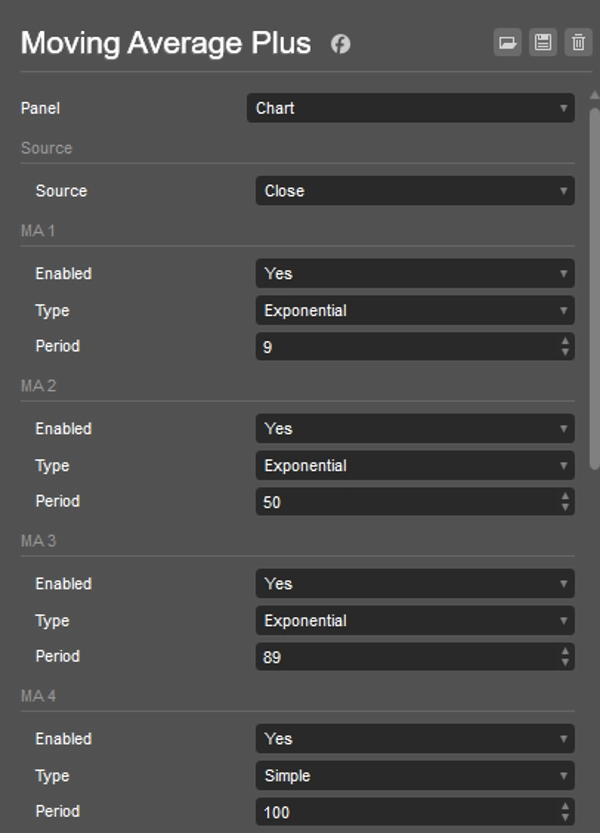
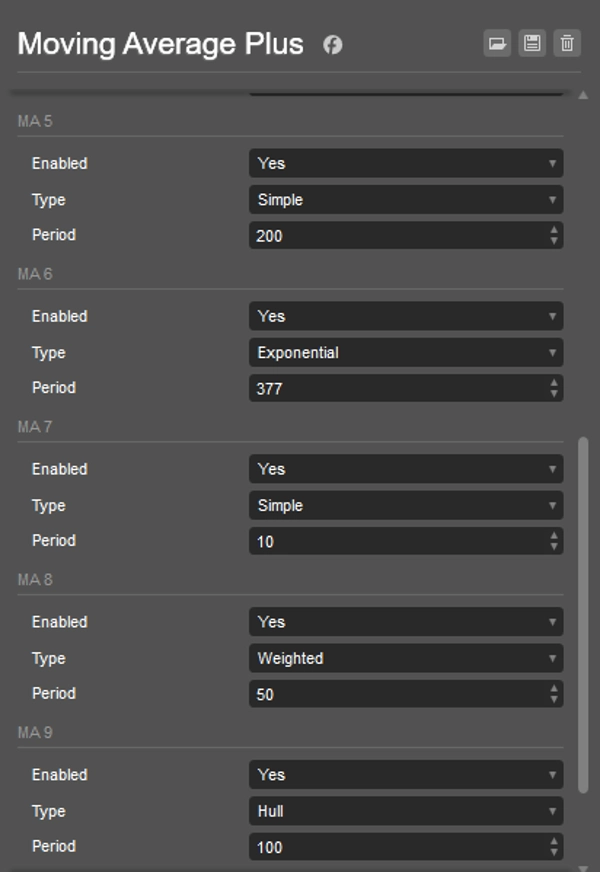
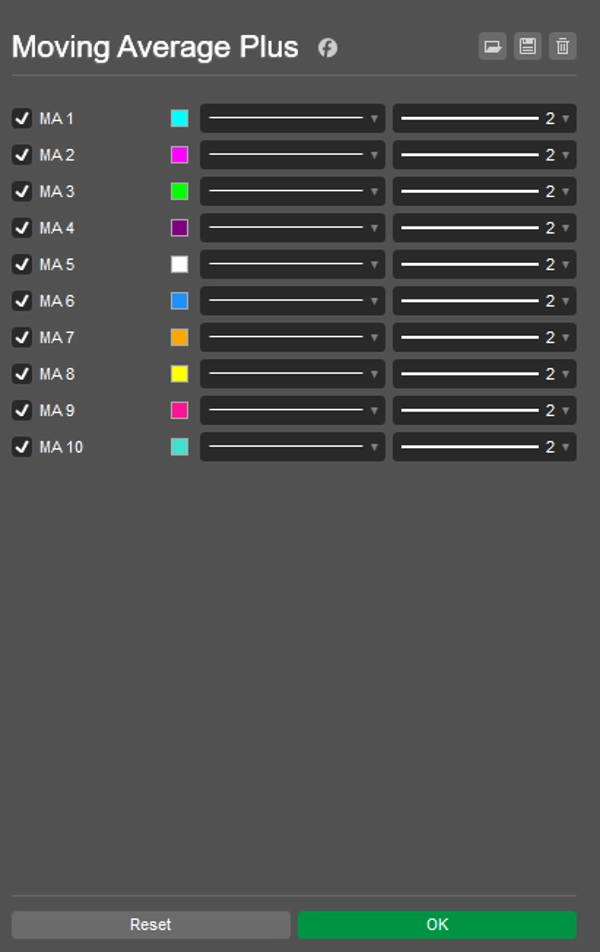
لكل خط (MA 1 … MA 10)
- مفعل – تشغيل/إيقاف الخط (الخطوط المعطلة لا تحسب).
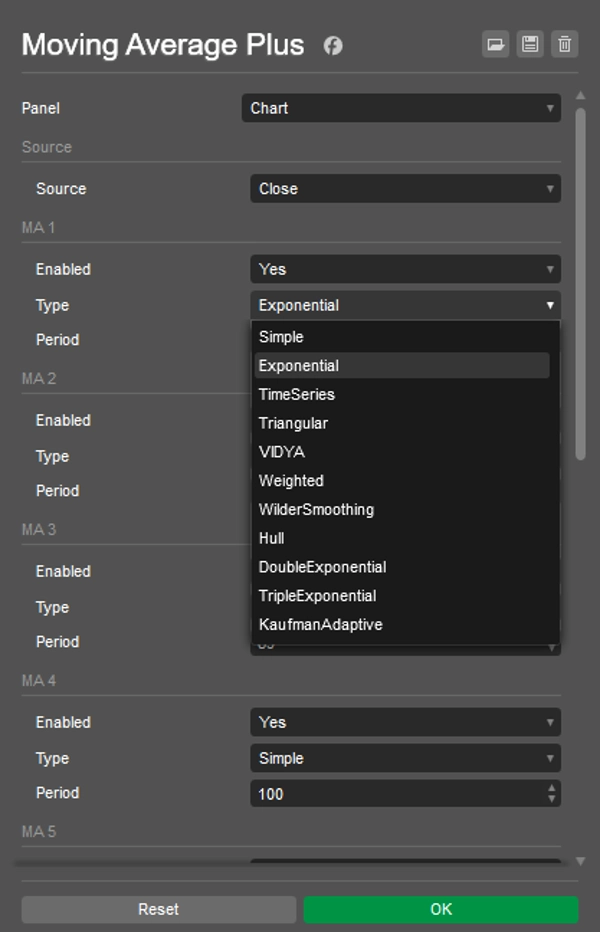
- النوع – اختر أيًا من
MovingAverageTypeفي cTrader (مثل، بسيط، أسي، مرجح، تنعيم وايلدر، هول، مثلثي، سلسلة زمنية، إلخ).
ملاحظة: بعض الأنواع تعتمد على إصدار cTrader الخاص بك؛ إذا لم يكن النوع متاحًا (مثل هول)، اختر نوعًا آخر. - الفترة – طول المتوسط المتحرك (≥1).
الألوان والسماكة
- يتم تعيينها في تبويب الألوان من معلمات المؤشر لكل مخرج ("MA 1" … "MA 10").
نصائح
- لتحسين الأداء، قم بتعطيل الخطوط غير المستخدمة.
- إذا قمت بتغيير المصدر أو النوع/الفترة، يعيد المؤشر الحساب تلقائيًا.
- وايلدر في cTrader يسمى تنعيم وايلدر (
MovingAverageType.WilderSmoothing).
الملخص
ملخص الذكاء الاصطناعي
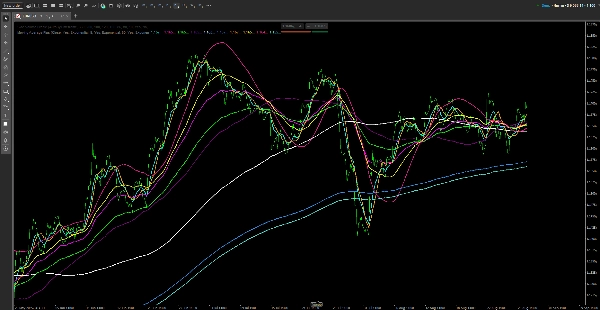
Moving Average Plus is a technical indicator for trading platforms that provides up to 10 configurable moving average lines. Each line can be individually enabled or disabled to optimize performance. Users select a single price source—such as Close, Open, High, Low, Median, Typical, or Weighted Close—that applies to all moving averages. For each line, the type of moving average can be chosen from various options including Simple, Exponential, Weighted, Wilder Smoothing, Hull, Triangular, and Time Series, depending on platform support. The period (length) of each moving average is adjustable with a minimum of 1. Colors and line thickness for each moving average are customizable through the indicator’s color settings. The indicator automatically recalculates when changes are made to the price source, type, or period. This tool is designed to assist traders in analyzing price trends by overlaying multiple moving averages with flexible configurations on their charts.
ملف تعريف المؤشر
تقييمات العملاء
0.0
التقييمات: 0
تقييمات العملاء
لا توجد تقييمات لهذا المنتج حتى الآن. هل جرَّبته بالفعل؟ كن أول من يخبر الآخرين!
مناقشة
الأسئلة الشائعة
يتم توفير المنتجات المتاحة من خلال cTrader Store، بما في ذلك روبوتات التداول والمؤشرات والإضافات، من قبل مطوري الطرف الثالث وإتاحتها لأغراض الوصول المعلوماتي والفني فقط. cTrader Store ليس وسيطًا ولا يقدم نصائح استثمارية أو توصيات شخصية أو أي ضمان للأداء المستقبلي.


السعر
منذ 26/05/2025
449.3M
حجم التداول
61.1K
الربح بالبيب
15
المبيعات
1.43K
التثبيتات المجانية