
TrendStrengthSignals
مؤشر
الإصدار 1.0، Aug 2025
Windows, Mac
5.0
التقييمات: 1
الوصف
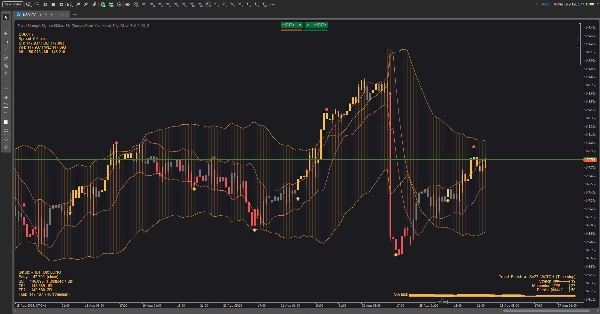
أداة بصرية لتداول الاتجاهات تمزج بين غلاف التقلبات وقناة مدركة للدورة لعرض النظام، التوقيت، والمخاطر بنظرة سريعة. تم تصميمها لتكون قابلة للقراءة على أي خلفية (فاتحة/داكنة) وللحفاظ على نظافة الشاشة مع إعطائك تلميحات "ماذا تفعل بعد ذلك".
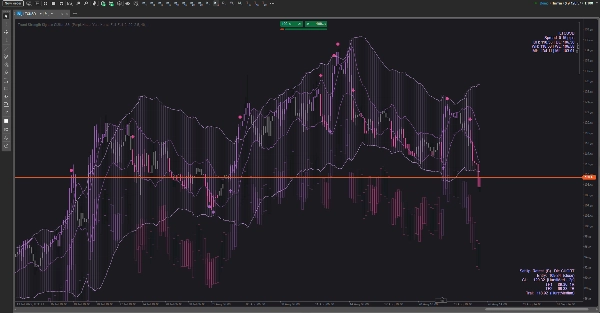
ما تراه على الرسم البياني
- السحب (قابلة للتبديل):
-
- سحابة التقلب التي تتوسع/تنكمش مع نشاط السوق.
- سحابة الدورة التي تتبع إيقاع السعر المتداول.
- يمكنك عرض أي منهما، أو كلاهما، أو لا شيء.
- الإشارات: سهام صاعدة/هابطة غير مزعجة لتحولات الاتجاه المحتملة؛ نقاط صغيرة لتحفيز جني الأرباح.
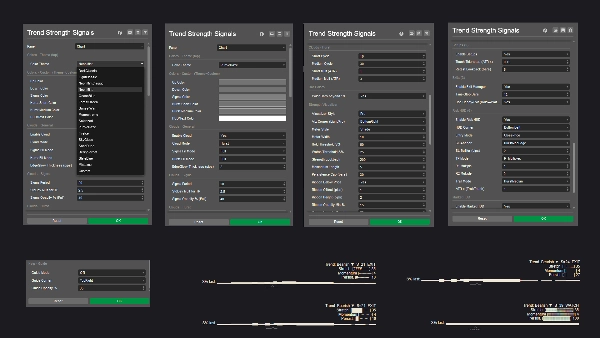
- شاشة قوة الاتجاه (ثلاثة أنماط):
-
- خفيف — علامة حالة مدمجة.
- محترف — لوحة صغيرة مع ثلاثة مقاييس (التمدد، الزخم، الاستمرارية) بالإضافة إلى رسم بياني صغير للتاريخ.
- شريط — شريط ناعم بالقرب من السعر يتبع شدة قوة الاتجاه.
- شاشة المخاطر: تقترح اتجاهًا، منطقة وقف حماية، هدفين ربح متدرجين، وفكرة تتبع اختيارية. توضع في أي زاوية تختارها وتتحدث مع تطور الشمعة.
- شاشة السوق: الرمز والفارق السعري، بالإضافة إلى مراجع أعلى-أدنى يومية/أسبوعية/شهرية، حتى تعرف دائمًا موقعك داخل الخريطة الأكبر.
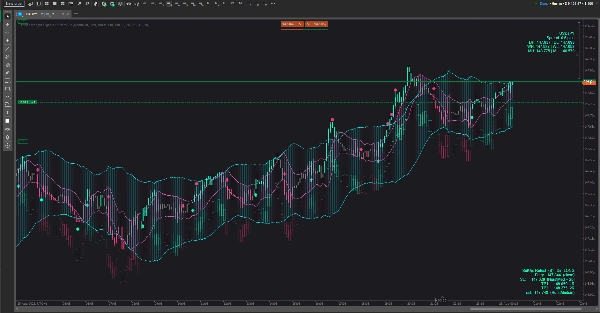
- الثيمات: مجموعات ألوان مختارة للرسوم الفاتحة والداكنة (ووضع مخصص). جميع العناصر الرسومية — بما في ذلك الشاشات والإشارات — تتبع الثيم النشط.
كيفية استخدامه (عملي، وليس تقني)
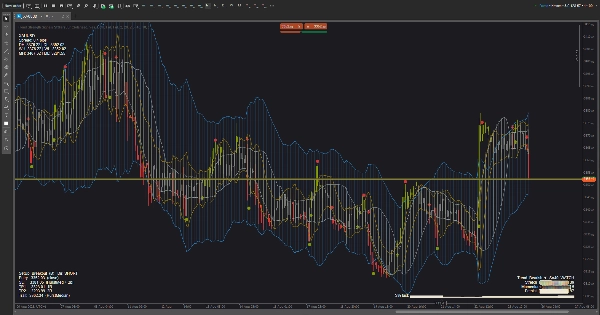
- اختر عرض السحابة الخاص بك:
-
- استخدم سحابة التقلب لرؤية الانضغاطات والتوسعات.
- استخدم سحابة الدورة للحكم على دورات "الحافة" مقابل "الوسط".
- استخدم كلاهما إذا كنت تريد السياق + التوقيت.
- اقرأ قوة الاتجاه:
-
- عندما تتصاعد الحالة إلى تثبيت، قم بتحيز التداولات مع الاتجاه الحالي؛ وعندما تنخفض إلى مراقبة، قلل العدوانية؛ إذا أظهرت خروج، تجنب التداولات الجديدة أو شد المخاطر.
- في وضع محترف، ارتفاع المقاييس + ارتفاع الرسم البياني الصغير = تحسن الجودة؛ انخفاض المقاييس = إدارة تقليل المخاطر.
- حدد مداخل الوقت مع السعر مقابل السحابة:
-
- الاختراقات بعد الانضغاط، وإعادة الدخول بعد ارتداد مهذب إلى السحابة، أو الارتدادات من الحافة الخارجية هي الأنماط الأساسية.
- إذا ظهر سهم مبكر في منتصف الشمعة ثم اختفى، انتظر تأكيد إغلاق الشمعة إذا كنت تفضل تقليل الإشارات الخاطئة.
- أدر التداول باستخدام شاشة المخاطر:
-
- ضع وقف الحماية تقريبًا خلف أقرب حد هيكلي يبرزه HUD.
- قم بالتدرج في الخروج عند TP1، ودع الباقي يستهدف TP2 أو يتبع خط التتبع المقترح.
- إذا تدهورت قوة الاتجاه من قوية إلى ضعيفة، فكر في الخروج مبكرًا.
- مرشحات الحالة:
-
- تجنب المداخل عندما تكون السحب رقيقة ومتقطعة، أو عندما تكون حالة القوة في وضع الخروج.
- فضل التداولات عندما تتصاعد القوة، وتميل السحابة، ويتفاعل السعر بوضوح مع الحواف.
التخصيص
- قم بتبديل زوايا الشاشة، ونمط العرض، وثيم الألوان لتتناسب مع مساحة عملك.
- الثيمات الصديقة للضوء تحافظ على وضوح النص على الخلفيات البيضاء؛ لوحات المحيط/الغابة/الغروب تضيف تباينًا خفيفًا بدون توهج.
ما هو ليس
هذه ليست أداة تداول آلية مغلقة. إنها مساعد قرار: تؤطر جودة الاتجاه، وتقترح مواقع مخاطرة معقولة، وتبرز اللحظات ذات الاحتمالية العالية — لكنك تظل المتحكم.
الملخص
ملف تعريف المؤشر
تقييمات العملاء
5.0
التقييمات: 1
5 | 100 % | |
4 | 0 % | |
3 | 0 % | |
2 | 0 % | |
1 | 0 % |
تقييمات العملاء
September 2, 2025
The reason it feels usable is direction is easier to respect, and a 1R exit plan makes review easier.
مناقشة
الأسئلة الشائعة
يتم توفير المنتجات المتاحة من خلال cTrader Store، بما في ذلك روبوتات التداول والمؤشرات والإضافات، من قبل مطوري الطرف الثالث وإتاحتها لأغراض الوصول المعلوماتي والفني فقط. cTrader Store ليس وسيطًا ولا يقدم نصائح استثمارية أو توصيات شخصية أو أي ضمان للأداء المستقبلي.


السعر
منذ 26/05/2025
385.09M
حجم التداول
60.66K
الربح بالبيب
14
المبيعات
1.4K
التثبيتات المجانية