
Candle Volume Profile Demo
مؤشر
465 التنزيلات
الإصدار 1.0، Nov 2025
Windows, Mac
4.0
التقييمات: 1
الوصف
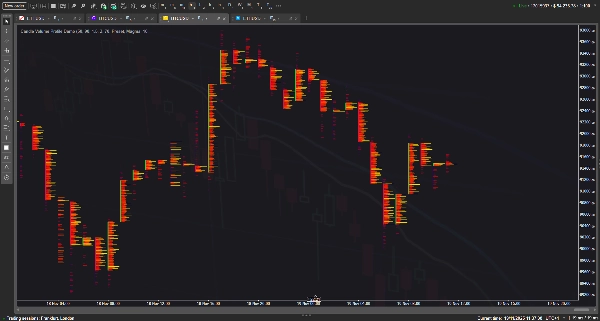
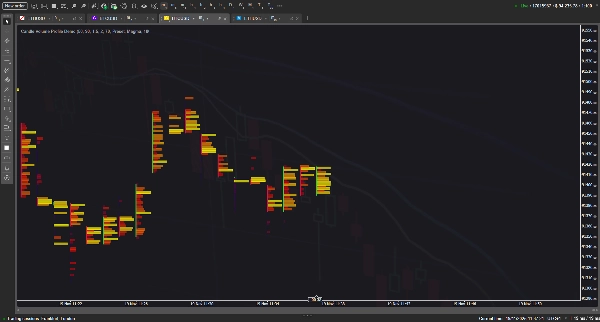
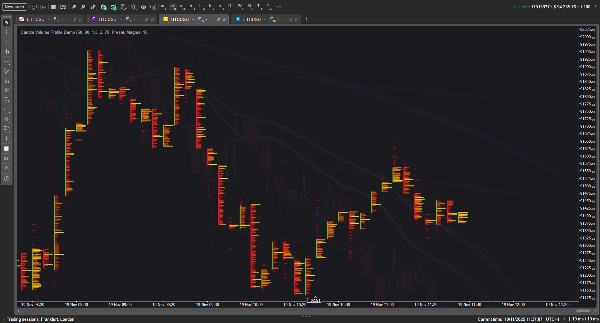
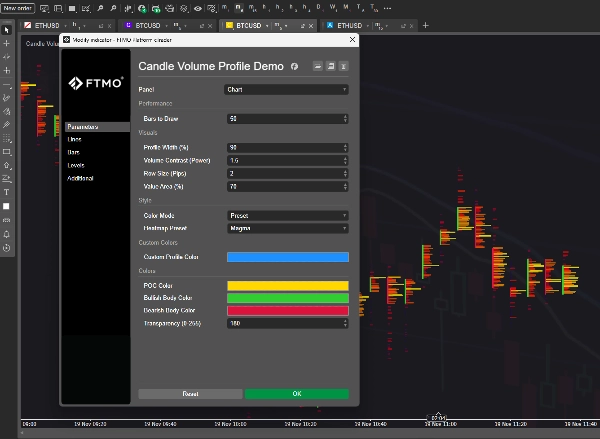
يعرض هذا المؤشر ملف الحجم للأشرطة الفردية، محولًا الشموع العادية إلى مخطط مفصل بأسلوب "البصمة" مع خرائط حرارية قابلة للتخصيص، وخطوط نقطة التحكم (POC)، وكتل منطقة القيمة لتسليط الضوء على توزيع الحجم لكل مستوى سعري. يهدف إلى محاكاة أدوات تدفق الأوامر الاحترافية باستخدام توزيع الحجم الاستدلالي لعرض نشاط السوق مباشرة على المخطط.
نظريًا، يجب أن يعمل هذا المفهوم بسلاسة لتوفير رؤى عميقة للسوق؛ ومع ذلك، في الممارسة العملية، بسبب العدد الهائل من الكائنات الرسومية المطلوبة للعرض، كلما زادت الميزات وعمق التاريخ الذي تطلبه من هذا المؤشر، زادت احتمالية تأخره والتسبب في عدم استقرار المحطة. :(
الملخص
ملخص الذكاء الاصطناعي
Candle Volume Profile Demo is an indicator designed for cryptocurrency markets, specifically visualizing volume distribution within individual candlestick bars. It transforms standard candlesticks into detailed footprint-style charts by applying heuristic volume profiling techniques. Key features include customizable heatmaps, Point of Control (POC) lines, and Value Area blocks, which highlight volume concentration at specific price levels. This approach aims to replicate professional order flow analysis by rendering market activity directly on the price chart, providing granular insights into volume dynamics per bar. The indicator supports BTCUSD and other crypto symbols, integrating concepts such as Fair Value Gap (FVG), ZigZag patterns, ATR, and VWAP for enhanced volume and volatility context. Users can adjust visualization parameters to explore volume profiles over different historical depths, though extensive feature use may impact performance due to graphical complexity. This tool is intended for traders seeking detailed volume-based market structure analysis within crypto trading environments.
ملف تعريف المؤشر
تقييمات العملاء
4.0
التقييمات: 1
5 | 0 % | |
4 | 100 % | |
3 | 0 % | |
2 | 0 % | |
1 | 0 % |
تقييمات العملاء
November 24, 2025
Candle Volume Profile Demo gives you a clean visual of volume distribution inside candles/ranges - a smart add-on for liquidity-aware traders. The visualization is sharp and performance solid, but as a demo version it lacks full features (history logs, advanced filters). Best when paired with structure and confirmation tools. A good starting point, ready to level up.
مناقشة
الأسئلة الشائعة
BTCUSD
Signal
ZigZag
Fair Value Gap
Crypto
ATR
VWAP
يتم توفير المنتجات المتاحة من خلال cTrader Store، بما في ذلك روبوتات التداول والمؤشرات والإضافات، من قبل مطوري الطرف الثالث وإتاحتها لأغراض الوصول المعلوماتي والفني فقط. cTrader Store ليس وسيطًا ولا يقدم نصائح استثمارية أو توصيات شخصية أو أي ضمان للأداء المستقبلي.


قد يعجبك أيضًا


السعر
منذ 26/05/2025
388.58M
حجم التداول
60.75K
الربح بالبيب
15
المبيعات
1.41K
التثبيتات المجانية