
Tracking Performance by Quantara
지표
31 다운로드
버전 1.0, Feb 2026
Windows, Mac
설명
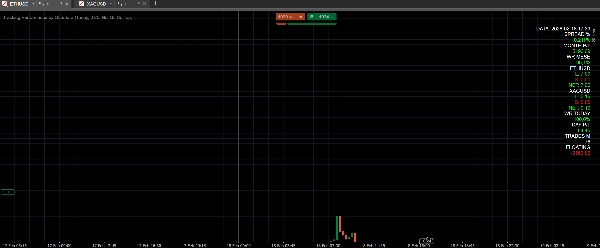
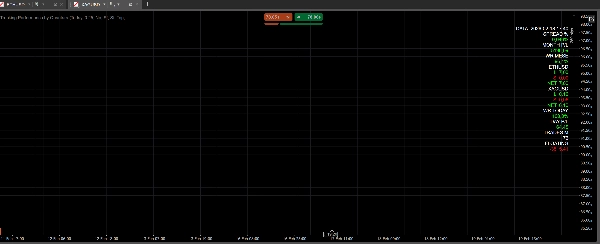
Quantara의 Tracking Performance는 대시보드 지표 로 실시간 성과 지표와 자산별 노출을 표시합니다.
월간 및 일간 손익, 월간 및 일간 승률, 월간 거래 횟수, 미실현 손익, 백분율 스프레드, 각 오픈 자산의 롱/숏/순 노출을 보여줍니다.
모든 값은 빠른 확인을 위해 색상으로 구분됩니다(양수/음수 손익, 승률 임계값, 롱은 녹색, 숏은 빨간색).
계산/표시 항목
- 스프레드 % (금속과 암호화폐에 대해 다른 임계값 적용)
- 월간 및 일간 손익
- 월간 및 일간 승률
- 월간 거래 횟수
- 미실현 손익
- 자산별 노출 (롱 / 숏 / 순)
추천 도구/시간 프레임
- 모든 도구 및 모든 시간 프레임
- 일일 모니터링을 위해 주요 차트(M15–H4)에서 권장
사용 방법
- 차트에 지표 추가
- 업데이트 간격 설정 (업데이트 초)
- Show Panel을 사용하여 표시 여부 전환
- “Show Symbol Only”를 사용하여 차트 심볼만 필터링
- “Use Local Time”을 사용하여 현지 시간 필터 적용
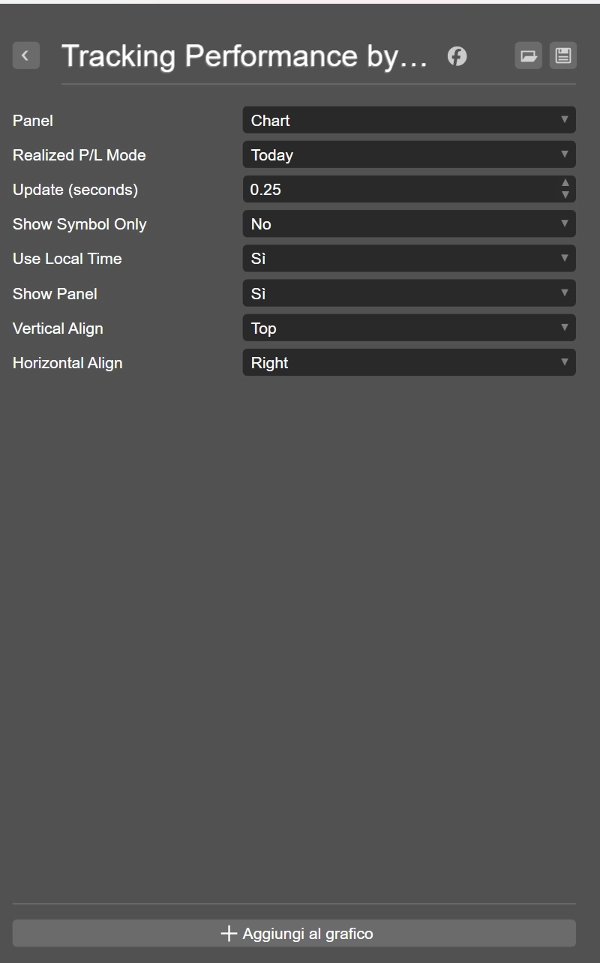
주요 매개변수
- 업데이트 (초): 새로 고침 빈도
- Show Symbol Only: 차트 심볼만 표시
- Use Local Time: 필터에 현지 시간 사용
- Show Panel: 패널 표시/숨기기
- 수직/수평 정렬: 패널 배치
사용 사례
- 자산별 순 노출 빠른 확인
- 일간 및 월간 성과 추적
- 운영 품질을 위한 승률 모니터링
- 금속 및 암호화폐 스프레드 % 모니터링
면책 조항
거래에는 위험이 따릅니다. 과거 성과가 미래 결과를 보장하지 않습니다.
요약
AI 요약
Tracking Performance by Quantara is a dashboard indicator designed for real-time monitoring of trading performance across multiple assets. It provides key metrics including monthly and daily profit and loss (P/L), win rate, trade count, floating P/L, and spread percentage, with specific thresholds for metals and cryptocurrencies. The indicator also displays per-asset exposure categorized as long, short, or net positions. All values are dynamically color-coded to facilitate quick interpretation, highlighting positive/negative P/L, win-rate levels, and position types.
This tool is compatible with any trading instrument and timeframe, with a recommendation for use on main charts ranging from 15-minute to 4-hour intervals for daily performance tracking. Users can customize update frequency, toggle panel visibility, filter data to the current chart symbol, and apply local time settings. The indicator supports quick assessment of net exposure, daily and monthly performance, win-rate monitoring, and spread percentage analysis for metals and crypto markets.
Key parameters include update interval, symbol filtering, local time usage, panel display options, and panel alignment. This indicator is applicable across Forex, Indices, Commodities, Crypto, and Stocks markets.
지표 프로필
고객 리뷰
0.0
리뷰: 0
고객 리뷰
이 상품에 대한 리뷰가 아직 없습니다. 이미 사용해 보셨나요? 다른 사람들에게 가장 먼저 소개해 주세요!
상담
자주 묻는 질문(FAQ)
Forex
Indices
Commodities
Crypto
Stocks
트레이딩 봇, 지표, 플러그인 등 cTrader Store에서 제공되는 상품은 제3자 개발자에 의해 제공되며, 이는 단순히 정보 및 기술적 접근을 목적으로 제공된 것입니다. cTrader Store는 중개인이 아니며, 투자 조언, 개인별 추천 또는 향후 성과에 대한 어떠한 보장도 제공하지 않습니다.


가격
가입일 29/01/2026
31
무료 설치