
NewsGuard High-Impact News Risk Overlay
مؤشر
2 عمليات الشراء
الإصدار 1.0، Jan 2026
Windows, Mac
5.0
التقييمات: 1
الوصف
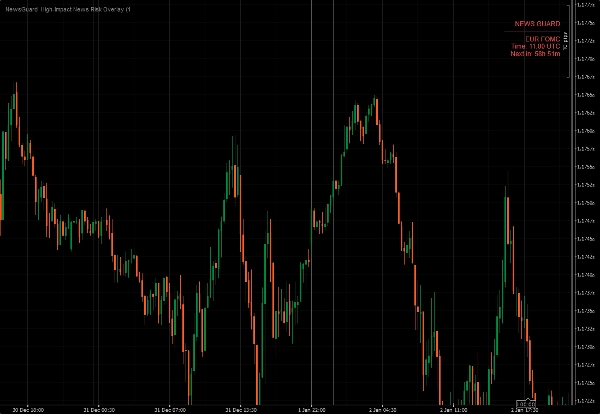
NewsGuard – طبقة مخاطر الأخبار ذات التأثير العالي هي أداة احترافية للوعي بالمخاطر لمنصة cTrader.
تُبرز بصريًا نوافذ زمنية حول الأحداث الاقتصادية الكبرى المعروفة بأنها تسبب تقلبات شديدة، وتوسع الفارق السعري، والانزلاق السعري.
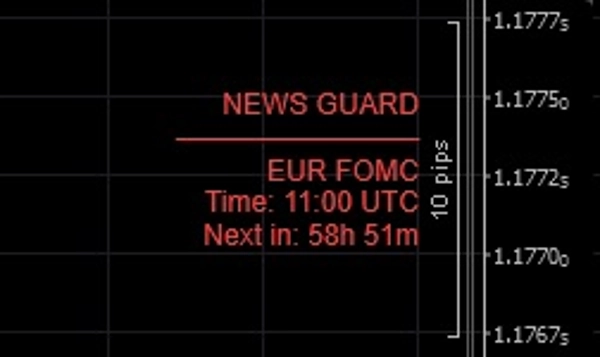
بدلاً من التفاعل بعد حدوث الحركة، يحذرك NewsGuard قبل زيادة المخاطر.
ما يعرضه NewsGuard
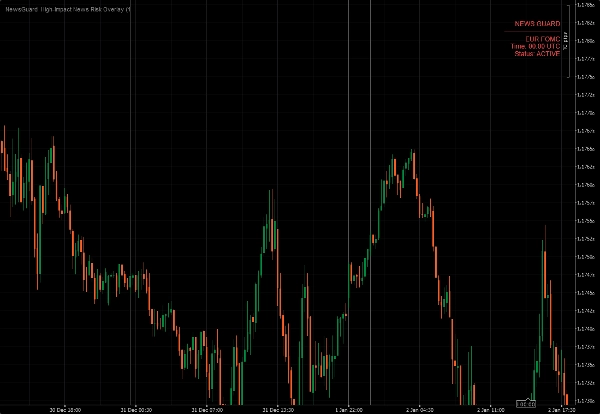
- مناطق مخاطر الأخبار ذات التأثير العالي مباشرة على الرسم البياني
- نافذة زمنية قابلة للتعديل قبل وبعد كل حدث
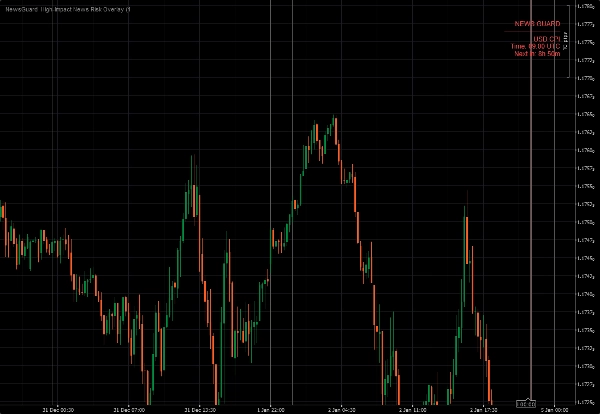
- طبقة نظيفة مع معلومات الأخبار القادمة أو النشطة
- تصفية تلقائية للملاءمة بناءً على الرمز المتداول
يستخدم NewsGuard جدول تأثير عالي يدوي، مما يجعله:
- موثوقًا
- آمنًا للتخزين
- مستقلاً عن المصادر الخارجية أو واجهات برمجة التطبيقات
ما ليس NewsGuard
- ليس موجز أخبار
- لا تنبؤات
- لا إشارات تداول
هو موجود لهدف واحد فقط:
لجعلك مدركًا للمخاطر القائمة على الوقت.
مثالي للمتداولين السريعين، ومتداولي اليوم، وأي شخص يرغب في تجنب التداول بشكل أعمى خلال الأحداث الإخبارية الكبرى.
الملخص
ملخص الذكاء الاصطناعي
NewsGuard High-Impact News Risk Overlay is a risk-awareness indicator designed for the cTrader platform. It visually marks time windows around major economic events known to cause significant market volatility, spread widening, and slippage. The overlay displays high-impact news risk zones directly on trading charts, allowing traders to anticipate periods of increased risk before volatility occurs. Users can adjust the time windows before and after each event to suit their trading preferences. The tool automatically filters news relevance based on the traded symbol, providing a clean and focused overlay with upcoming or active news information. NewsGuard relies on a manually maintained high-impact news schedule, ensuring reliability and independence from external data feeds or APIs. It does not provide news feeds, forecasts, or trade signals; its sole purpose is to enhance trader awareness of time-based risk. This indicator is suitable for scalpers, day traders, and others who want to avoid entering trades blindly during major news events. Supported markets include Forex, indices, and popular symbols such as GBPUSD, XAUUSD (gold), and NAS100.
ملف تعريف المؤشر
تقييمات العملاء
5.0
التقييمات: 1
5 | 100 % | |
4 | 0 % | |
3 | 0 % | |
2 | 0 % | |
1 | 0 % |
تقييمات العملاء
January 16, 2026
Poor entries are easier to skip, but the tool is just one part of the process.
مناقشة
الأسئلة الشائعة
Forex
Breakout
Scalping
Indices
GBPUSD
XAUUSD
NAS100
يتم توفير المنتجات المتاحة من خلال cTrader Store، بما في ذلك روبوتات التداول والمؤشرات والإضافات، من قبل مطوري الطرف الثالث وإتاحتها لأغراض الوصول المعلوماتي والفني فقط. cTrader Store ليس وسيطًا ولا يقدم نصائح استثمارية أو توصيات شخصية أو أي ضمان للأداء المستقبلي.
المزيد من هذا المؤلف


![شعار "Gaussian Channel [Iridio Capital]"](https://cdn.ctrader.com/image/webp/7c039209-5573-4a54-a072-f9528b503103_41960)


السعر
منذ 02/01/2026
2
المبيعات