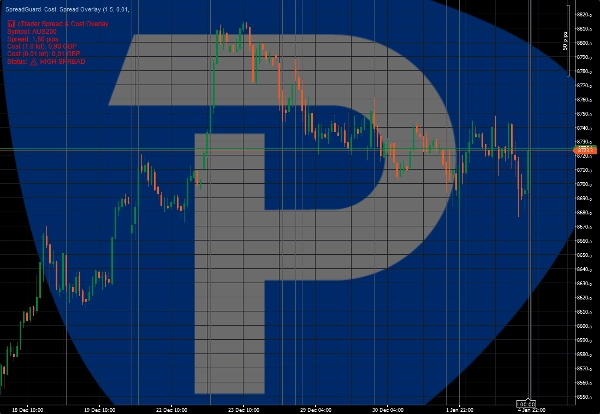
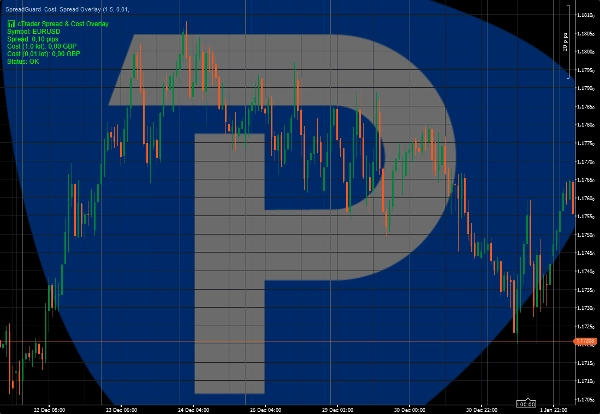
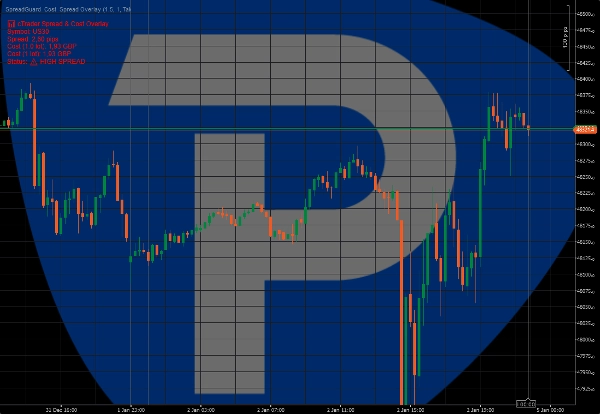
شعار "SpreadGuard  Cost  Spread Overlay"
SpreadGuard Cost Spread Overlay
صورة "SpreadGuard  Cost  Spread Overlay" المحملة
منذ 02/01/2026

cTrader Spread & Cost Overlay is a lightweight indicator designed to visualize real-time trading costs directly on the chart.

The indicator shows the current spread in pips and calculates the estimated cost of a trade based on the selected lot size. A visual warning highlights periods of high spread, helping traders avoid unfavorable execution conditions.

Key features:
• Live spread display (pips)
• Estimated trade cost for selected lot size
• Visual warning when spread exceeds a defined threshold
• Clean on-chart overlay

This indicator does not place trades or generate trading signals.
It is intended as an execution and risk-awareness tool for manual traders.

Suitable for scalpers, intraday traders, and prop firm accounts.

*Early access price. Future updates may be released at a higher regular price.

Indicator profile
0.0
التقييمات: 0
تقييمات العملاء
لا توجد تقييمات لهذا المنتج حتى الآن. هل جرَّبته بالفعل؟ كن أول من يخبر الآخرين!
Prop
Forex
EURUSD
ATR
GBPUSD
Products available through cTrader Store, including trading bots, indicators and plugins, are provided by third-party developers and made available for informational and technical access purposes only. cTrader Store is not a broker and does not provide investment advice, personal recommendations or any guarantee of future performance.

المزيد من هذا المؤلف

Visual session structure showing Asia, London and New York high/low ranges directly on the chart.
Visual warning zones for high-impact news so you can manage risk before volatility hits.

قد يعجبك أيضًا

ZLEMA (Zero Lag EMA) is a faster, smoother version of EMA, ideal for capturing quick market shifts and trends.
Master RSI reversals with Parabolic SAR precision! Get real-time alerts for high-probability trend changes.
MFI- MTF is a multi-timeframe momentum indicator that brings higher timeframe perspective to your current chart
🎯Smart Signals : Auto Buy/Sell alerts with dynamic TP/SL algorithm. 💡
PDHL - Previous Day High&Low
Custom Vwap Indicator
🧠Visually marks momentum zones when the RSI crosses the overbought/oversold thresholds (default 70/30). ✅
Spot strong trends and market direction with precision using this professional-grade ADX indicator.
RSI
Visually map NASDAQ liquidity cycles on your chart using exact NY time. Includes a live countdown dashboard.
شعار "MACD Plus"
5.0
(2)
مجاني
A visually enhanced MACD with colored histograms to clearly show trend strength.
Trade with the hidden edge — identify bullish and bearish dominance instantly
Combines multiple Currency Pairs / Symbols into a single Weighted Average Strength of that currency.
Enhance trading with TSV! Analyze volume flow and price trends using the powerful Time Segmented Volume indicator.
This is the first version I offer you for free.
Trend-coloring Donchian cloud that highlights volatility squeezes and breakouts.
Catch High-Probability Reversals with Precision Swing
منذ 02/01/2026