
PivotLevels
مؤشر
1 عمليات الشراء
الإصدار 1.0، Sep 2025
Windows, Mac
4.5
التقييمات: 2
الوصف
مؤشر نقاط المحور
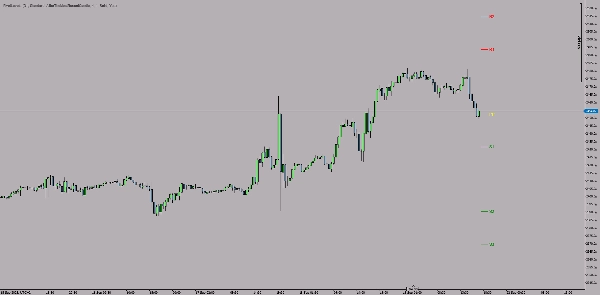
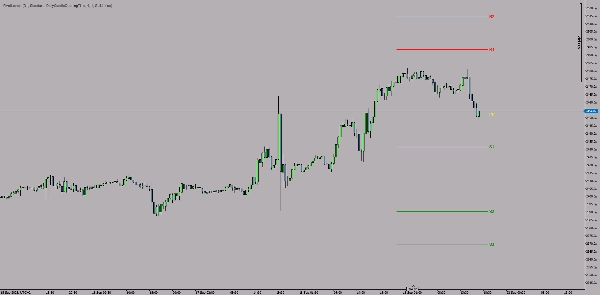
نقاط المحور هو مؤشر فني لمنصة cTrader يقوم تلقائيًا بحساب وعرض نقاط المحور كخطوط اتجاه على الرسم البياني.
الميزات الرئيسية:
🎯 أنواع المحاور:
- نقاط المحور القياسية
- نقاط محاور فيبوناتشي
- نقاط محاور وودي
- نقاط محاور كاماريلا
📊 المستويات:
- نقطة المحور المركزية (PP) - أصفر
- مستويات المقاومة (R1, R2, R3) - أحمر
- مستويات الدعم (S1, S2, S3) - أخضر
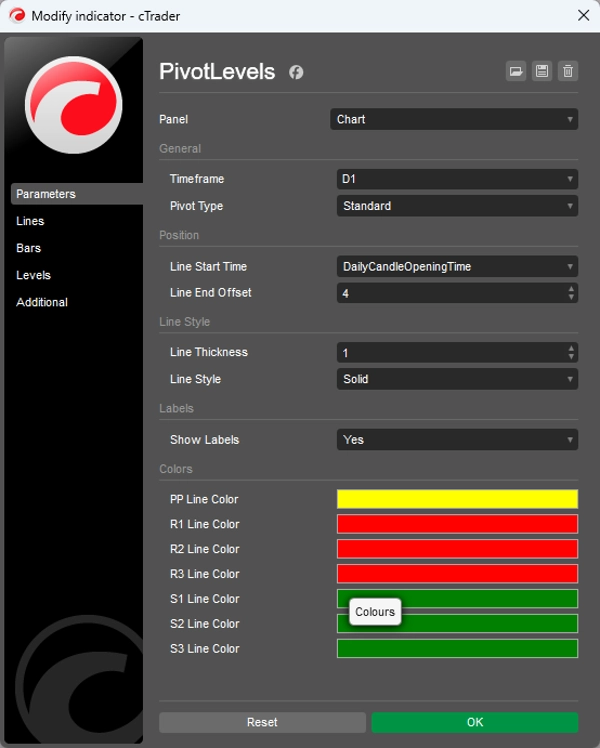
⚙️ الإعدادات القابلة للتخصيص:
- الإطار الزمني: اختيار يومي، أسبوعي، أو إطار زمني آخر
- نمط الخط: السماكة (1-5) والنوع (متصل، متقطع، إلخ)
- الموضع: وقت بداية الخط وطوله
- الألوان: قابلية تعديل لون كل مستوى بشكل فردي
- التسميات: تبديل تسميات النص تشغيل/إيقاف
💡 الاستخدام:
يقوم المؤشر بحساب مستويات المحور بناءً على قيم الأعلى، الأدنى، الإغلاق (والفتح) للفترة السابقة (يوم/أسبوع)، والتي تحدد مناطق الدعم والمقاومة الرئيسية للفترة التداولية التالية.
مثالي للمتداولين المتأرجحين واليوميين الذين يطبقون استراتيجيات تعتمد على المستويات الفنية.
الملخص
ملخص الذكاء الاصطناعي
PivotLevels is a technical indicator for the cTrader platform that automatically calculates and displays pivot points as trendlines on trading charts. It supports multiple pivot point calculation methods, including Standard, Fibonacci, Woodie, and Camarilla pivots. The indicator plots key levels such as the Central Pivot Point (PP) in yellow, resistance levels (R1, R2, R3) in red, and support levels (S1, S2, S3) in green.
Users can customize various settings, including the timeframe for pivot calculation (daily, weekly, or others), line style (thickness and type), line positioning (start time and length), colors for each level, and the option to toggle text labels on or off. The pivot levels are derived from the previous period’s high, low, close, and open prices, helping identify potential support and resistance zones for the upcoming trading period.
This indicator is suitable for traders who use technical levels in their strategies, particularly swing and day traders. It supports multiple markets such as forex, indices, commodities, cryptocurrencies, and stocks.
ملف تعريف المؤشر
تقييمات العملاء
4.5
التقييمات: 2
5 | 50 % | |
4 | 50 % | |
3 | 0 % | |
2 | 0 % | |
1 | 0 % |
تقييمات العملاء
September 30, 2025
The review gets easier when the decision feels less rushed, and The setup needs patience.
مناقشة
الأسئلة الشائعة
Prop
Forex
Indices
Commodities
Crypto
Stocks
يتم توفير المنتجات المتاحة من خلال cTrader Store، بما في ذلك روبوتات التداول والمؤشرات والإضافات، من قبل مطوري الطرف الثالث وإتاحتها لأغراض الوصول المعلوماتي والفني فقط. cTrader Store ليس وسيطًا ولا يقدم نصائح استثمارية أو توصيات شخصية أو أي ضمان للأداء المستقبلي.


السعر
منذ 05/01/2025
14
المبيعات