✨ الميزات الرئيسية
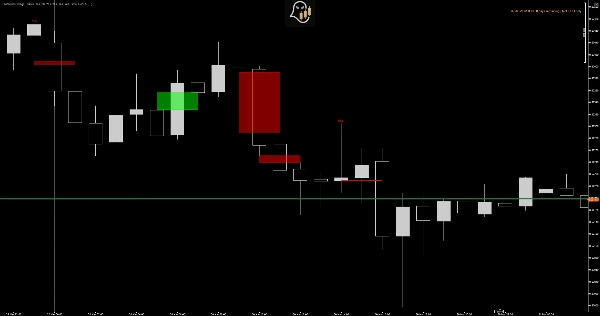
🔍 اكتشاف مسح السيولة
- يحدد تلقائيًا عندما يتجاوز السعر مستويات المحور لالتقاط السيولة
- يميز بين الاختراقات الحقيقية والحركات الخاطئة (صيد الوقف)
- يبرز المنطقة الدقيقة التي تم أخذ السيولة فيها
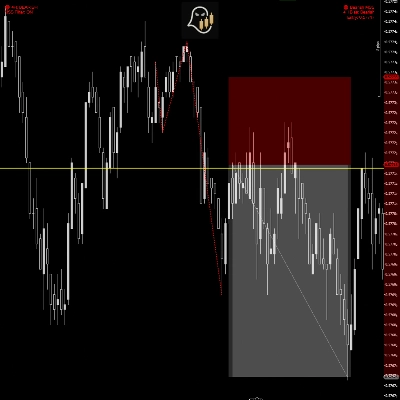
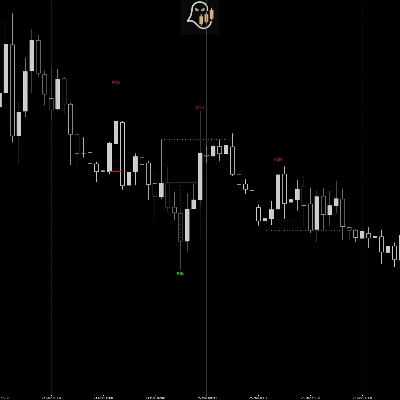
📦 تحليل فجوة القيمة العادلة (FVG)
- يكتشف فجوات القيمة العادلة الصاعدة والهابطة في الوقت الحقيقي
- يتتبع تخفيف FVG عبر أطر زمنية متعددة
- صناديق بصرية تظهر الفجوات النشطة وحالة ملئها
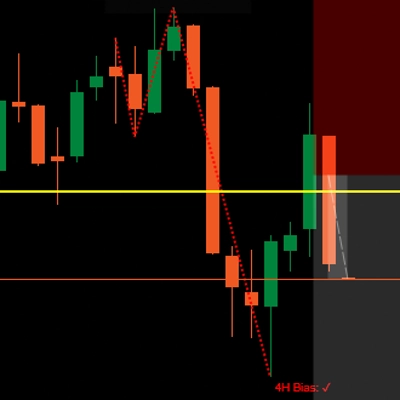
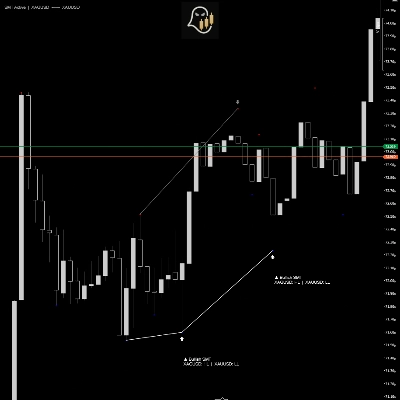
🎯 تحديد التأرجح المحمي
- يحدد أدنى وأعلى تأرجحات محمية (PSL و PSH)
- يعطي إشارات فقط عندما تتبع التأرجحات مسحات السيولة أو تخفيفات FVG
- يقضي على الضوضاء عن طريق تصفية نقاط التأرجح غير المهمة
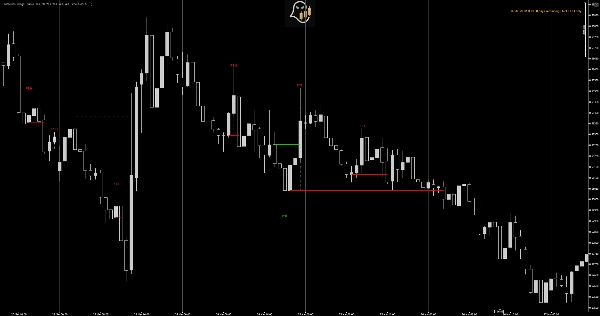
⚡ منطق تأكيد CISD
- يستخدم منهجية "تغيير حالة التسليم"
- ينتظر تأكيد السعر فوق/تحت المستويات الرئيسية
- يبطل الإعدادات تلقائيًا عند ضرب نقاط الوقف
🎨 التصور الاحترافي
- عرض نظيف وغير متداخل للرسم البياني
- ألوان وشفافية قابلة للتخصيص
- تلميحات مفصلة تظهر سبب كل إشارة
- تمديد تلقائي للمستوى لتسهيل تخطيط الأهداف
💡 لماذا التأرجحات المحمية؟
المشكلة مع المؤشرات التقليدية
معظم مؤشرات التأرجح تحدد كل قمة وقاع، مما يخلق ازدحامًا في الرسم البياني وإشارات خاطئة. لا تميز بين تقلبات السعر العشوائية والنشاط المؤسسي الحقيقي.
حل التأرجحات المحمية
بالمطالبة إما بمسح السيولة أو تخفيف FVG قبل تحديد التأرجح، يضمن هذا المؤشر أنك ترى فقط الإعدادات التي أظهر فيها المال الذكي يده. هذا يحسن جودة الإشارة بشكل كبير ويقلل من التقلبات الخاطئة.
🚀 كيف يعمل
1. مرحلة الكشف
يقوم المؤشر بمسح مستمر لـ:
- قمم وقيعان المحور (حساسية قابلة للتكوين)
- مسحات السيولة (حركات الشمعة فقط التي تتجاوز المحاور)
- فجوات القيمة العادلة (عدم كفاءة السعر)
2. تشكيل التأرجح
عندما يتشكل قاع/قمة تأرجح وَ يتبع إما:
- مسح سيولة لمحور سابق، أو
- دخول السعر في فجوة قيمة عادلة، يقوم المؤشر بتحديده كتأرجح محمي "قيد الانتظار".
3. مرحلة التأكيد (CISD)
يتم تأكيد التأرجح فقط عندما:
- بالنسبة لـ PSL: يغلق السعر فوق المستوى دون كسر قاع التأرجح
- بالنسبة لـ PSH: يغلق السعر تحت المستوى دون كسر قمة التأرجح
4. الإبطال
إذا كسر السعر نقطة التأرجح قبل التأكيد، يتم تجاهل الإعداد. هذا يحافظ على نظافة الرسوم البيانية ويركز فقط على الإعدادات الصالحة.
📈 تطبيقات التداول
إدخالات استمرار الاتجاه
- PSLs في الاتجاهات الصاعدة = فرص شراء مع نقاط وقف ضيقة
- PSHs في الاتجاهات الهابطة = فرص بيع مع مخاطرة محددة
التداول العكسي
- عدة PSLs عند مستويات متشابهة = منطقة تراكم قوية
- عدة PSHs عند مستويات متشابهة = منطقة توزيع/مقاومة
وضع وقف الخسارة
- ضع نقاط الوقف فقط بعد PSLs المؤكدة للمراكز الطويلة
- ضع نقاط الوقف فقط بعد PSHs المؤكدة للمراكز القصيرة
- منهجية Stop Defended تضمن وضع المخاطرة الأمثل
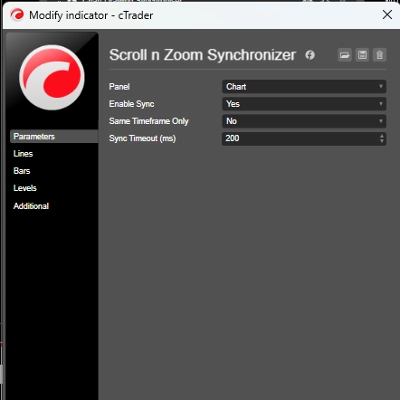
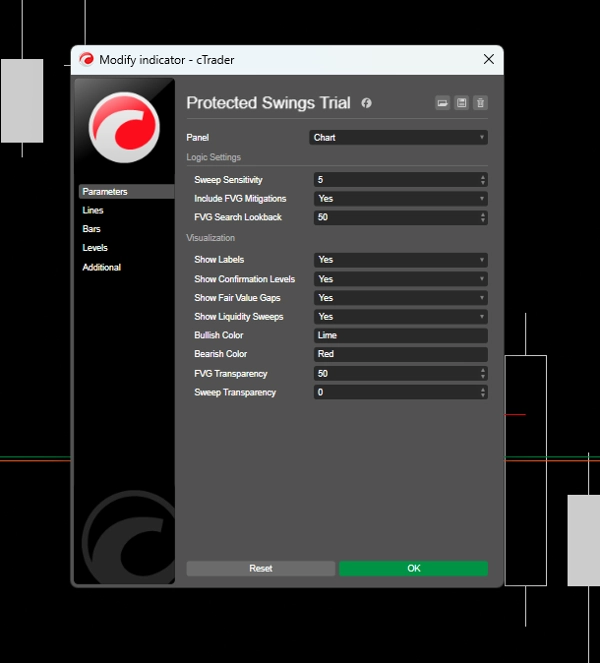
⚙️ معلمات قابلة للتخصيص
إعدادات المنطق
- حساسية المسح (1-20): تتحكم في أهمية المحور - الأعلى = إشارات أقل ولكن أقوى
- تضمين تخفيفات FVG: تشغيل/إيقاف إشارات FVG
- مدة البحث عن FVG: مدة بقاء FVGs نشطة
### التصور
- عرض التسميات: عرض علامات PSL/PSH
- عرض مستويات التأكيد: رسم خطوط أفقية عند مستويات الدخول
- عرض فجوات القيمة العادلة: عرض صناديق FVG
- عرض مسحات السيولة: تمييز مناطق المسح
- ألوان مخصصة: تخصيص كامل للألوان للعناصر الصاعدة/الهابطة
- ضوابط الشفافية:** ضبط شدة العرض حسب تفضيلك
## ⚠️ قيود النسخة التجريبية
هذه نسخة تجريبية لمدة 7 أيام مع القيود التالية:
✅ المتضمن:
- وظائف المؤشر كاملة
- جميع الميزات مفتوحة
- دعم جميع الأطر الزمنية على NZDUSD
- تخصيص كامل للمعلمات
❌ القيود:
- الرمز: يعمل فقط على مخططات NZDUSD
- المدة: فترة تجريبية لمدة 7 أيام من التثبيت
- الدعم: دعم تجريبي محدود
### 🔓 فوائد النسخة الكاملة
- يعمل على جميع أزواج العملات، الأسهم، المؤشرات، والسلع**
- وصول مدى الحياة - بدون انتهاء صلاحية
- تحديثات مجانية مدى الحياة
- دعم أولوية من GhostInTheSpread
- دليل مستخدم مفصل مع استراتيجيات التداول
- دروس فيديو وأدلة إعداد
5 | 50 % | |
4 | 50 % | |
3 | 0 % | |
2 | 0 % | |
1 | 0 % |