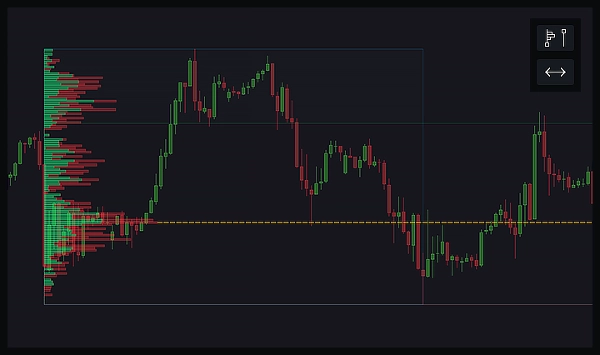
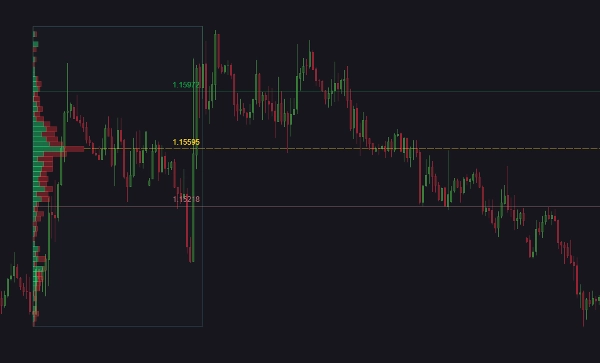
الوسطاء وشركات پروپ
للأعمال
00
Days
:
00
Hours
:
00
Minutes
:
00
Seconds
مؤشر
Breakout
VegaXLR - Fixed Range Volume Profile
4.3
12/12/2025
27
Desktop
منذ 24/09/2024
المبيعات
138
التثبيتات المجانية
401
صورة "VegaXLR - Fixed Range Volume Profile" المحملة

A Fixed Range Volume Profile is a tool that shows how much trading activity occurred at different price levels within a specific range on a chart. You draw a rectangle over the area you're interested in, and the profile displays horizontal bars indicating the volume of trades at each price level within that range. This helps you see where the most buying and selling happened, highlighting key price levels that might be important for making trading decisions.


Key components of the Fixed Range Volume Profile include:

  • Point of Control (POC): The price level with the highest trading volume within the selected range. This is often seen as a significant support or resistance level because it reflects a price where a lot of trading activity took place.
  • Value Area High (VAH): The upper boundary of the price range where 70% of the total trading volume occurred. Prices above this level are considered less traded and potentially overvalued.
  • Value Area Low (VAL): The lower boundary of the price range where 70% of the total trading volume occurred. Prices below this level are considered less traded and potentially undervalued.

These lines help traders identify significant price levels that can act as support or resistance. By understanding where the bulk of trading volume is concentrated, traders can make more informed decisions about potential price movements, entry, and exit points.

For example, if the current price is near the POC, it might indicate a strong support or resistance level. If the price is within the value area, it suggests that it is in a fair value range, while prices outside the value area might be seen as potential breakout or breakdown points.

What this Indicator Does:

This indicator enhances your trading chart with powerful volume profile analysis and customizable alerts. With two intuitive buttons, you can easily draw fixed range volume profiles and expand or contract key levels to infinity. The volume profile can be visualized in two different modes, total or up and down bars. Adjust the number of levels, data resolution (Precise or Fast), and the size of the value area to suit your needs.

Magnetic ranges automatically update based on the last candle, ensuring your analysis stays current. You can also customize the appearance and behavior of the profile and its components, including POC, VAH, and VAL lines. Alerts can be set for price touches, with options to trigger actions like starting or stopping cBots, and closing positions. Alerts can be delivered via sound, cTrader pop-ups, Telegram messages (with optional screenshots), and emails.

Features:

  • Fixed Range Volume Profile: Draw a rectangle to visualize the volume profile of a selected range.
  • Expand/Contract Lines: Extend or contract POC, VAH, and VAL lines to infinity.
  • Volume Profile Modes: Choose between total volume or up and down bars.
  • Customizable Levels and Resolution: Select the number of levels and resolution (Precise or Fast).
  • Adjustable Value Area: Set the size of the value area.
  • Magnetic Ranges: Automatically resize ranges to align with the last candle, updated every 1–10 minutes or on bar close.
  • Customizable Appearance: Change the position, size, and style of buttons, lines, and volume bars.
  • Alerts for Price Touches: Get notified when price touches POC, VAH, or VAL lines.
  • cBot Integration: Start or stop cBots based on alerts.
  • Position Management: Close positions when alerts occur, with customizable options for each line (POC, VAH, and VAL).
  • Alert Methods: Receive alerts via sound, cTrader pop-ups, Telegram messages (with optional screenshots), and emails.
  • Performance Optimization: Option to auto-delete past ranges not visible on the chart to improve performance.
  • Global Alert Control: Easily enable or disable all alerts from this indicator.
  • User Guide: You can easily open the user guide of this indicator through a small button on the chart.


4.3
التقييمات: 3
5
67 %
4
0 %
3
33 %
2
0 %
1
0 %
تقييمات العملاء
November 12, 2025
This indicator is extremely well-crafted and very easy to use, especially thanks to the ability to freely adjust the volume calculation range. I believe that adding the option to display it in delta volume profile mode would take it to the next level. It’s already excellent, but with that feature, it could become truly outstanding.
August 18, 2025
Draws fixed‑range volume profiles with POC, VAH/VAL and customizable settings. Supports up/down mode, alerts for price touches, and cBot integration. Cons: No tooltips or presets. Can lag when many ranges active. Lacks history/export features.
July 9, 2025
Well. It's pretty nice but often I can't remove frame once I add it. It's annoying bug. Please fix it.
المزيد من هذا المؤلف
الأعلى تقييمًا
مجاني
VegaXLR cTrader Toolbox
Centralized access to VegaXLR's cBots, indicators, and educational content in cTrader.
مؤشر
Indices
Prop
Stocks
+3
VegaXLR - Unlimited Trendline Alerts
This is an indicator that can alert you about trendlines, horizontal lines and vertical lines.
الأعلى تقييمًا
مجاني
مؤشر
Indices
Prop
Stocks
+3
VegaXLR - cTrader Chart Themes
Free chart themes for the cTrader platform.
VegaXLR - Chart Patterns Alerts
Enhance your trading strategy with automated detection and alerts for key chart patterns.
cBot
Indices
Stocks
Forex
+2
VegaXLR - Risk Manager
Automate lot sizing with cTrader Risk Manager cBot for precise risk management in pending and market orders.
VegaXLR - Candlestick Patterns Alerts
Real-Time Candlestick Pattern Detection with Custom Alerts & Trend Analysis for cTrader
مؤشر
Indices
Stocks
Forex
+1
VegaXLR - Moving Average Alerts
A powerful cTrader indicator with customizable Moving Average alerts, notifications, and automated trading actions.
VegaXLR - cTrader Multi-Timeframe Pivot Pro
Customizable multi-timeframe pivot point indicator for cTrader with alerts, Fibonacci, CPR, and more!
VegaXLR - ZigZag Alerts
cTrader ZigZag Alerts: Precision Swing Detection, Alerts, and Fibonacci.
cBot
RSI
VegaXLR - cTrader Account Protector
This is an advanced tool designed to protect your trading account by managing drawdown and run-up levels.
VegaXLR - RSI and StochRSI Alerts
VegaXLR's cTrader StochRSI identifies overbought/oversold RSI levels for precise trade entries.
VegaXLR - Candlestick Patterns Pro
Identify 34 candlestick patterns, track trends across timeframes, and get instant alerts with this powerful trading tool
VegaXLR - Auto Support and Resistance
cTrader Auto Support & Resistance detects key levels with Fibonacci analysis and sends real-time trading alerts.
مؤشر
Forex
Crypto
VegaXLR - Bar Close Alert Manager
Bar Close Alert Manager provides real-time alerts for bar closures with customizable notifications and automation.
cBot
Indices
Stocks
Commodities
+2
VegaXLR - Trendline Trading cBot
This is a cBot that will detect trendlines on the chart and open trades when the price interacts with them.
VegaXLR - Market Sessions Alerts
The cTrader Market Sessions Alerts Indicator marks global sessions, highlights key levels, and sends real-time alerts.
مؤشر
Forex
Fibonacci
VegaXLR - Analysis Tools Alerts
Enhance your trading with customizable alerts and dynamic visual tools for trendlines, Fibonacci levels, and more.
cBot
Forex
VegaXLR - Profit Defender
cTrader Profit Defender: Safeguard Your Gains with Advanced Trailing Stops.
قد يعجبك أيضًا
IR Macd on Chart
this indicator show macd on chart.
مؤشر
EURUSD
Compare Symbol
Plots chosen symbol's close price, candlestick (wick, body) on cTrader chart, supports multiple timeframes.
مؤشر
Indices
Prop
Stocks
+5
New Way Sar - Free
The Parabolic SAR, or "Stop and Reverse," is a dynamic technical analysis tool
مؤشر
Forex
Signal
Ariaware.003PGap
The Pressure Gap indicator identifies sudden price jumps without using volume.
مؤشر
VWAP
RSI
Breakout
+7
Anchored VWAP by LudwigICT
📈 Anchored VWAP with auto High/Low, session resets, Daily VWAP & TWAP — precise, Pine-accurate port.
مؤشر
Indices
XAUUSD
Breakout
+5
VQTX 2026 ULTRA
🚀 VQTX Indicator - The Ultimate Volatility & Trend Analysis Tool 🚀
الأعلى تقييمًا
مجاني
Support Resistance Zones
Support and Resistance.
Time To Break Even Lite Version
This is the trial version of Time To Break Even, which help you time your trade entry.
مؤشر
Breakout
BreakOut_Probability_Expo
Break Out Probability Experimental indicator. Credits for this indicator goes to Zeiierman !!!
IVB 2.0
IVB 2.0 is an indicator that works on the strategy of imbalance of the maximum volatility box of indices
Market Polarity Zones
implifies market analysis by automatically identifying bullish 🚀 or bearish 🐻 phases and marking key levels where ....
Market Sessions V2_NSC
Market Session V2: Full Control. colors, history, session/text toggles, font size. Elevate your strategy!
مؤشر
Indices
ATR
Stocks
+6
Triple Momentum
The Triple Momentum indicator for cTrader is a versatile trend-following tool.
مؤشر
ZigZag
NAS100
RSI
+7
WAVETREND_withSourceCode
The WaveTrend Indicator is a multifunctional oscillator designed to center the trend wave or movements in the trend.
مؤشر
Indices
Prop
Forex
+1
Vision - Advanced Session Indicator
Weekly Daily Levels
The Weekly Daily Levels indicator shows the OHLC, and mid-point prices for the previous day and week.
Cumulative Delta_noSourceCode
Demo of my main indcator.
مؤشر
Indices
Commodities
Stocks
+2
MARainbow
MARainbow gives you the edge with four customizable moving averages—each color-coded for instant recognition.