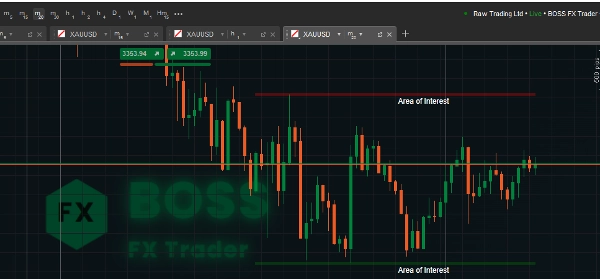
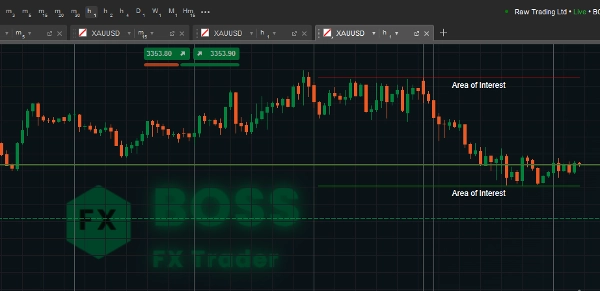
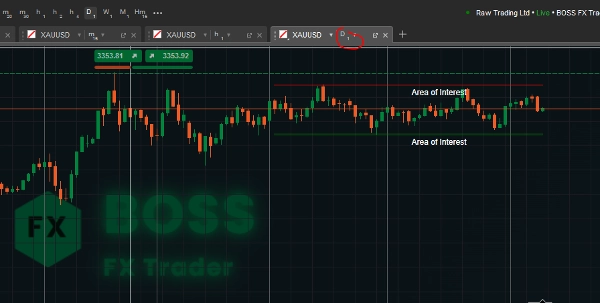
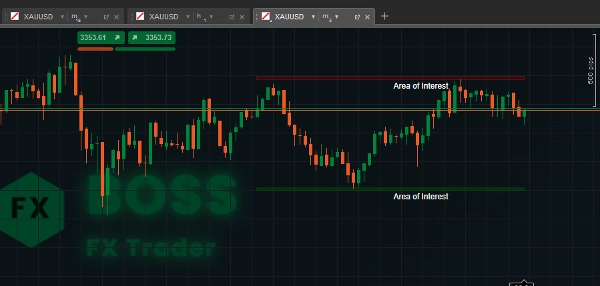
Area of Interest
「Area of Interest」ロゴ
23/08/2025
2
Desktop
登録日 29/05/2025
取引高
1.04M
獲得pips
10.46K
販売
12
無料インストール
148
「Area of Interest」アップロード画像「Area of Interest」アップロード画像「Area of Interest」アップロード画像「Area of Interest」アップロード画像

1. Purpose of the Indicator

This Area of Interest cTrader indicator identifies support and resistance zones within a user-defined lookback period, and visually highlights them as “Areas of Interest” on your chart.
It helps traders quickly see key price levels where reversals or breakouts are more likely to occur.

2. How the Code Works

  • Lookback Period – The number of previous bars (candles) the indicator will scan to find the highest high and lowest low.
  • Higher values → broader zones.
  • Lower values → more recent levels.
  • Zone Height – The vertical size (thickness) of the support/resistance area in pips.
  • Helps make the zone more visible and adjustable.
  • Clears old drawings before plotting new ones to avoid clutter.
  • Collects high and low prices for the lookback range.
  • Finds the highest and lowest price levels (resistance & support).
  • Converts zone height from pips to actual price value.

3. Usage Instructions

  1. Attach the Indicator
    • Open cTrader, load a chart, click Indicators → Custom → AreaOfInterest.
  2. Adjust Parameters
    • Lookback Period:
      • For swing trading → Use larger values (e.g., 100–200).
      • For scalping → Use smaller values (e.g., 20–50).
    • Zone Height: Adjust to your trading style and instrument volatility.
  3. Interpreting the Zones
    • Red Zone (Resistance) – Price tends to reverse or slow down when entering this zone.
    • Green Zone (Support) – Price often bounces upward from here.
    • Look for:
      • Price rejection
      • Candlestick patterns (pin bars, engulfing)
      • Confluence with other indicators (EMA, RSI, Fibonacci)
  4. Trading Examples
    • Bounce Trade: Enter long near the green zone with a stop just below it.
    • Breakout Trade: Wait for prices to close above the red zone for a bullish breakout.
    • False Break Detection: Watch for wicks beyond the zone but closed inside (possible reversals).


A profitable trader used this tool.


0.0
レビュー: 0
カスタマーレビュー
この商品にはまだレビューがありません。お使いになったことがある方は、ぜひレビューをお願いします。
この作成者の他の商品
Market Sessions
Market Sessions is very important for traders.
FractalArrowBuySell
Fractal Arrow Buy and Sell Indicator
MultiTF-Pivot_SR
MultiTF Pivot and SR Indicator
cBot
Grid
NAS100
NZDUSD
+17
Quick Trading Panel
Quick Trading Panel Cbot allows you to trade faster using a panel in a chart. This includes Trailing Trigger and Locked.
インジケーター
NAS100
NZDUSD
Martingale
+22
Zigzag Trend
The ZigZag Trend is a market structure tool that filters out small price fluctuations and highlights major swing.
Break of Structure
The Break of Structure (BoSCHoCh) Indicator is a smart market structure tool designed to help traders easily spot trend.
インジケーター
NAS100
NZDUSD
Martingale
+22
Candle Timer
Candle Timer best used for Scalper
Market BIAS Detector
The Market BIAS Detector is a smart trading assistant designed to identify the market.
SpreadCalculator - BossFXTrader
Spread Calculator to calculate the difference between two prices or values.
インジケーター
NAS100
NZDUSD
XAUUSD
+12
Volume Meter
Volume Meter
これも好きかも
インジケーター
RSI
Breakout
XAUUSD
+6
Fair Value Gap Sessions
identify and highlight temporary market inefficiencies known as "fair value gaps" 🚨 within specific trading Sessions.
インジケーター
NAS100
NZDUSD
XAUUSD
+10
RT Time Segmented Volume
Enhance trading with TSV! Analyze volume flow and price trends using the powerful Time Segmented Volume indicator.
VolumeRenkoRange
Volume for Renko/Range
インジケーター
NZDUSD
Breakout
FVG
+7
SmartMoneyConceptsIndicator
Automatically displays "Smart Money Concepts" used by professional traders.
Golden Boom And Crash Spike Detector
Golden Boom and Crash Spike Detector is a trading tool designed for Crash 300 and Boom 300 indices on M1 Timeframe.
IR Multi Data
show symbol and time fram, daily net profit percent, daily net profit, and spread ln your chart. consider that timezone
Market Polarity Zones
implifies market analysis by automatically identifying bullish 🚀 or bearish 🐻 phases and marking key levels where ....
StochasticRSI
Stochastic RSI (StochRSI) is a technical indicator used to measure the strength and weakness of the RSI.
MultiTF-Pivot_SR
MultiTF Pivot and SR Indicator
supertrend
Supertrend Indicator for cTrader
インジケーター
RSI
Breakout
XAUUSD
+12
Liquidity Pressure Index
Liquidity Pressure Index is a tool that gives traders deeper insights into the hidden dynamics of market liquidity
インジケーター
Grid
NAS100
RSI
+16
Smart Money Breakout Channels
Smart Money Breakout Channels – Auto-detect breakout zones with price, volume & volatility insights on cTrader.
インジケーター
Indices
XAUUSD
Breakout
+9
Market Bias Gauge
Measure Market Strength at a Glance – Instantly
vpdi
VPDI (open, close, high and low with % of the previous day and price changes in % of the previous day's close)
Cumulative Delta_noSourceCode
Demo of my main indcator.
VixFix
A volatility spike detector based on Larry Williams’ VIX Fix. Highlights market fear moments with clear histogram signal
Buy and sell indicator
Buy and Sell Signals
SmartArrows AI V2
High-Performance Renko Chart Indicator with Advanced AI Filtering.